Stock Analysis
XNET Corporation's (TSE:4762) Stock's On An Uptrend: Are Strong Financials Guiding The Market?


Most readers would already be aware that XNET's (TSE:4762) stock increased significantly by 27% over the past three months. Since the market usually pay for a company’s long-term fundamentals, we decided to study the company’s key performance indicators to see if they could be influencing the market. Specifically, we decided to study XNET's ROE in this article.
ROE or return on equity is a useful tool to assess how effectively a company can generate returns on the investment it received from its shareholders. Simply put, it is used to assess the profitability of a company in relation to its equity capital.
View our latest analysis for XNET
How Do You Calculate Return On Equity?
The formula for ROE is:
Return on Equity = Net Profit (from continuing operations) ÷ Shareholders' Equity
So, based on the above formula, the ROE for XNET is:
9.1% = JP¥759m ÷ JP¥8.3b (Based on the trailing twelve months to December 2023).
The 'return' is the profit over the last twelve months. So, this means that for every ¥1 of its shareholder's investments, the company generates a profit of ¥0.09.
Why Is ROE Important For Earnings Growth?
Thus far, we have learned that ROE measures how efficiently a company is generating its profits. Depending on how much of these profits the company reinvests or "retains", and how effectively it does so, we are then able to assess a company’s earnings growth potential. Assuming all else is equal, companies that have both a higher return on equity and higher profit retention are usually the ones that have a higher growth rate when compared to companies that don't have the same features.
XNET's Earnings Growth And 9.1% ROE
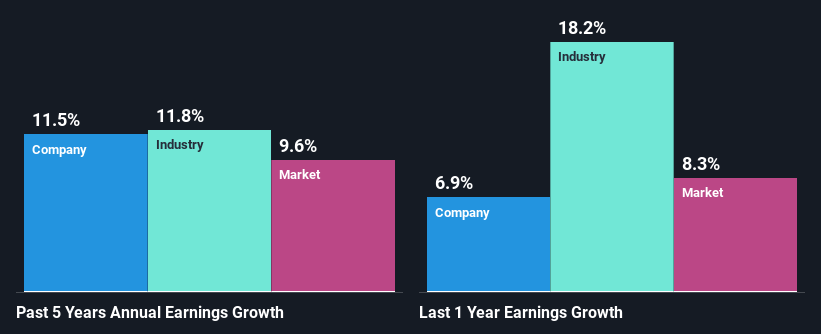
To start with, XNET's ROE looks acceptable. Yet, the fact that the company's ROE is lower than the industry average of 12% does temper our expectations. XNET was still able to see a decent net income growth of 11% over the past five years. We reckon that there could be other factors at play here. For example, it is possible that the company's management has made some good strategic decisions, or that the company has a low payout ratio. Bear in mind, the company does have a respectable level of ROE. It is just that the industry ROE is higher. So this also does lend some color to the fairly high earnings growth seen by the company.
As a next step, we compared XNET's net income growth with the industry and found that the company has a similar growth figure when compared with the industry average growth rate of 12% in the same period.
Earnings growth is an important metric to consider when valuing a stock. It’s important for an investor to know whether the market has priced in the company's expected earnings growth (or decline). This then helps them determine if the stock is placed for a bright or bleak future. One good indicator of expected earnings growth is the P/E ratio which determines the price the market is willing to pay for a stock based on its earnings prospects. So, you may want to check if XNET is trading on a high P/E or a low P/E, relative to its industry.
Is XNET Efficiently Re-investing Its Profits?
Summary
On the whole, we feel that XNET's performance has been quite good. Particularly, we like that the company is reinvesting heavily into its business at a moderate rate of return. Unsurprisingly, this has led to an impressive earnings growth. If the company continues to grow its earnings the way it has, that could have a positive impact on its share price given how earnings per share influence long-term share prices. Remember, the price of a stock is also dependent on the perceived risk. Therefore investors must keep themselves informed about the risks involved before investing in any company. Our risks dashboard would have the 3 risks we have identified for XNET.
Valuation is complex, but we're helping make it simple.
Find out whether XNET is potentially over or undervalued by checking out our comprehensive analysis, which includes fair value estimates, risks and warnings, dividends, insider transactions and financial health.
View the Free AnalysisHave feedback on this article? Concerned about the content? Get in touch with us directly. Alternatively, email editorial-team (at) simplywallst.com.
This article by Simply Wall St is general in nature. We provide commentary based on historical data and analyst forecasts only using an unbiased methodology and our articles are not intended to be financial advice. It does not constitute a recommendation to buy or sell any stock, and does not take account of your objectives, or your financial situation. We aim to bring you long-term focused analysis driven by fundamental data. Note that our analysis may not factor in the latest price-sensitive company announcements or qualitative material. Simply Wall St has no position in any stocks mentioned.
About TSE:4762
Flawless balance sheet and good value.

