Stock Analysis
- Japan
- /
- Healthcare Services
- /
- TSE:9229
Are Strong Financial Prospects The Force That Is Driving The Momentum In Sunwels Co.,Ltd.'s TSE:9229) Stock?


SunwelsLtd's (TSE:9229) stock is up by a considerable 22% over the past week. Since the market usually pay for a company’s long-term fundamentals, we decided to study the company’s key performance indicators to see if they could be influencing the market. Specifically, we decided to study SunwelsLtd's ROE in this article.
Return on equity or ROE is a key measure used to assess how efficiently a company's management is utilizing the company's capital. In simpler terms, it measures the profitability of a company in relation to shareholder's equity.
Check out our latest analysis for SunwelsLtd
How To Calculate Return On Equity?
Return on equity can be calculated by using the formula:
Return on Equity = Net Profit (from continuing operations) ÷ Shareholders' Equity
So, based on the above formula, the ROE for SunwelsLtd is:
26% = JP¥1.7b ÷ JP¥6.6b (Based on the trailing twelve months to December 2023).
The 'return' is the profit over the last twelve months. So, this means that for every ¥1 of its shareholder's investments, the company generates a profit of ¥0.26.
What Has ROE Got To Do With Earnings Growth?
Thus far, we have learned that ROE measures how efficiently a company is generating its profits. We now need to evaluate how much profit the company reinvests or "retains" for future growth which then gives us an idea about the growth potential of the company. Assuming everything else remains unchanged, the higher the ROE and profit retention, the higher the growth rate of a company compared to companies that don't necessarily bear these characteristics.
A Side By Side comparison of SunwelsLtd's Earnings Growth And 26% ROE
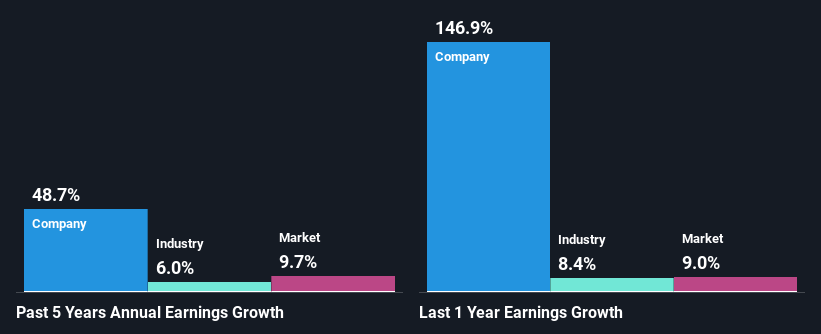
First thing first, we like that SunwelsLtd has an impressive ROE. Additionally, the company's ROE is higher compared to the industry average of 9.2% which is quite remarkable. So, the substantial 49% net income growth seen by SunwelsLtd over the past five years isn't overly surprising.
As a next step, we compared SunwelsLtd's net income growth with the industry, and pleasingly, we found that the growth seen by the company is higher than the average industry growth of 6.0%.
Earnings growth is an important metric to consider when valuing a stock. The investor should try to establish if the expected growth or decline in earnings, whichever the case may be, is priced in. This then helps them determine if the stock is placed for a bright or bleak future. If you're wondering about SunwelsLtd's's valuation, check out this gauge of its price-to-earnings ratio, as compared to its industry.
Is SunwelsLtd Making Efficient Use Of Its Profits?
SunwelsLtd doesn't pay any regular dividends to its shareholders, meaning that the company has been reinvesting all of its profits into the business. This is likely what's driving the high earnings growth number discussed above.
Summary
On the whole, we feel that SunwelsLtd's performance has been quite good. Specifically, we like that the company is reinvesting a huge chunk of its profits at a high rate of return. This of course has caused the company to see substantial growth in its earnings. Having said that, the company's earnings growth is expected to slow down, as forecasted in the current analyst estimates. Are these analysts expectations based on the broad expectations for the industry, or on the company's fundamentals? Click here to be taken to our analyst's forecasts page for the company.
Valuation is complex, but we're helping make it simple.
Find out whether SunwelsLtd is potentially over or undervalued by checking out our comprehensive analysis, which includes fair value estimates, risks and warnings, dividends, insider transactions and financial health.
View the Free AnalysisHave feedback on this article? Concerned about the content? Get in touch with us directly. Alternatively, email editorial-team (at) simplywallst.com.
This article by Simply Wall St is general in nature. We provide commentary based on historical data and analyst forecasts only using an unbiased methodology and our articles are not intended to be financial advice. It does not constitute a recommendation to buy or sell any stock, and does not take account of your objectives, or your financial situation. We aim to bring you long-term focused analysis driven by fundamental data. Note that our analysis may not factor in the latest price-sensitive company announcements or qualitative material. Simply Wall St has no position in any stocks mentioned.
About TSE:9229
Exceptional growth potential with solid track record.

