Stock Analysis
- Japan
- /
- Food and Staples Retail
- /
- TSE:2692
Has ITOCHU-SHOKUHIN Co., Ltd.'s (TSE:2692) Impressive Stock Performance Got Anything to Do With Its Fundamentals?


Most readers would already be aware that ITOCHU-SHOKUHIN's (TSE:2692) stock increased significantly by 9.2% over the past week. We wonder if and what role the company's financials play in that price change as a company's long-term fundamentals usually dictate market outcomes. Specifically, we decided to study ITOCHU-SHOKUHIN's ROE in this article.
ROE or return on equity is a useful tool to assess how effectively a company can generate returns on the investment it received from its shareholders. Put another way, it reveals the company's success at turning shareholder investments into profits.
Check out our latest analysis for ITOCHU-SHOKUHIN
How Is ROE Calculated?
The formula for ROE is:
Return on Equity = Net Profit (from continuing operations) ÷ Shareholders' Equity
So, based on the above formula, the ROE for ITOCHU-SHOKUHIN is:
5.3% = JP¥5.6b ÷ JP¥107b (Based on the trailing twelve months to December 2023).
The 'return' is the income the business earned over the last year. One way to conceptualize this is that for each ¥1 of shareholders' capital it has, the company made ¥0.05 in profit.
Why Is ROE Important For Earnings Growth?
So far, we've learned that ROE is a measure of a company's profitability. Based on how much of its profits the company chooses to reinvest or "retain", we are then able to evaluate a company's future ability to generate profits. Assuming everything else remains unchanged, the higher the ROE and profit retention, the higher the growth rate of a company compared to companies that don't necessarily bear these characteristics.
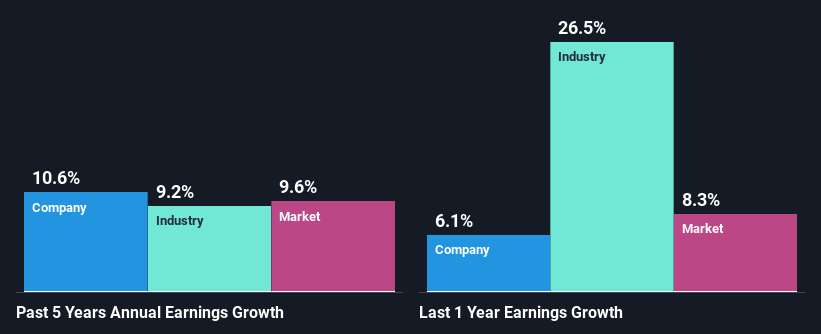
A Side By Side comparison of ITOCHU-SHOKUHIN's Earnings Growth And 5.3% ROE
When you first look at it, ITOCHU-SHOKUHIN's ROE doesn't look that attractive. We then compared the company's ROE to the broader industry and were disappointed to see that the ROE is lower than the industry average of 9.1%. Although, we can see that ITOCHU-SHOKUHIN saw a modest net income growth of 11% over the past five years. We reckon that there could be other factors at play here. For instance, the company has a low payout ratio or is being managed efficiently.
Next, on comparing ITOCHU-SHOKUHIN's net income growth with the industry, we found that the company's reported growth is similar to the industry average growth rate of 9.2% over the last few years.
Earnings growth is an important metric to consider when valuing a stock. What investors need to determine next is if the expected earnings growth, or the lack of it, is already built into the share price. This then helps them determine if the stock is placed for a bright or bleak future. One good indicator of expected earnings growth is the P/E ratio which determines the price the market is willing to pay for a stock based on its earnings prospects. So, you may want to check if ITOCHU-SHOKUHIN is trading on a high P/E or a low P/E, relative to its industry.
Is ITOCHU-SHOKUHIN Using Its Retained Earnings Effectively?
ITOCHU-SHOKUHIN's three-year median payout ratio to shareholders is 22% (implying that it retains 78% of its income), which is on the lower side, so it seems like the management is reinvesting profits heavily to grow its business.
Besides, ITOCHU-SHOKUHIN has been paying dividends for at least ten years or more. This shows that the company is committed to sharing profits with its shareholders.
Summary
On the whole, we do feel that ITOCHU-SHOKUHIN has some positive attributes. Despite its low rate of return, the fact that the company reinvests a very high portion of its profits into its business, no doubt contributed to its high earnings growth.
Valuation is complex, but we're helping make it simple.
Find out whether ITOCHU-SHOKUHIN is potentially over or undervalued by checking out our comprehensive analysis, which includes fair value estimates, risks and warnings, dividends, insider transactions and financial health.
View the Free AnalysisHave feedback on this article? Concerned about the content? Get in touch with us directly. Alternatively, email editorial-team (at) simplywallst.com.
This article by Simply Wall St is general in nature. We provide commentary based on historical data and analyst forecasts only using an unbiased methodology and our articles are not intended to be financial advice. It does not constitute a recommendation to buy or sell any stock, and does not take account of your objectives, or your financial situation. We aim to bring you long-term focused analysis driven by fundamental data. Note that our analysis may not factor in the latest price-sensitive company announcements or qualitative material. Simply Wall St has no position in any stocks mentioned.
About TSE:2692
ITOCHU-SHOKUHIN
Engages in the wholesale of food products and alcoholic beverages in Japan.
Flawless balance sheet with solid track record and pays a dividend.

