Stock Analysis
- Japan
- /
- Consumer Durables
- /
- TSE:4204
Sekisui Chemical Co., Ltd.'s (TSE:4204) Stock Been Rising: Are Strong Financials Guiding The Market?


Sekisui Chemical's (TSE:4204) stock up by 9.8% over the past three months. Given its impressive performance, we decided to study the company's key financial indicators as a company's long-term fundamentals usually dictate market outcomes. In this article, we decided to focus on Sekisui Chemical's ROE.
Return on equity or ROE is a key measure used to assess how efficiently a company's management is utilizing the company's capital. In short, ROE shows the profit each dollar generates with respect to its shareholder investments.
Check out our latest analysis for Sekisui Chemical
How Is ROE Calculated?
The formula for return on equity is:
Return on Equity = Net Profit (from continuing operations) ÷ Shareholders' Equity
So, based on the above formula, the ROE for Sekisui Chemical is:
9.6% = JP¥79b ÷ JP¥821b (Based on the trailing twelve months to March 2024).
The 'return' is the yearly profit. So, this means that for every ¥1 of its shareholder's investments, the company generates a profit of ¥0.10.
What Has ROE Got To Do With Earnings Growth?
We have already established that ROE serves as an efficient profit-generating gauge for a company's future earnings. Depending on how much of these profits the company reinvests or "retains", and how effectively it does so, we are then able to assess a company’s earnings growth potential. Assuming everything else remains unchanged, the higher the ROE and profit retention, the higher the growth rate of a company compared to companies that don't necessarily bear these characteristics.
A Side By Side comparison of Sekisui Chemical's Earnings Growth And 9.6% ROE
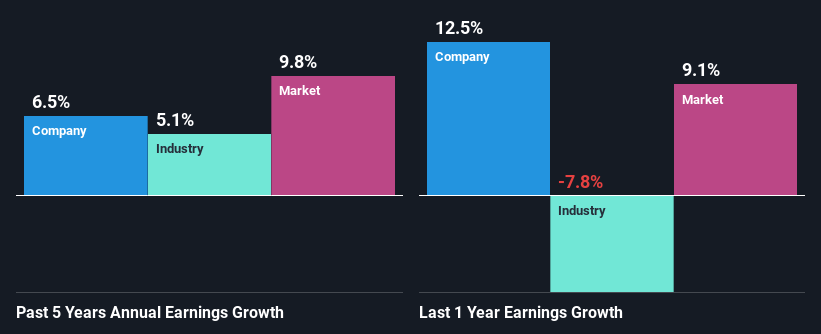
At first glance, Sekisui Chemical seems to have a decent ROE. Further, the company's ROE compares quite favorably to the industry average of 7.2%. This probably laid the ground for Sekisui Chemical's moderate 6.5% net income growth seen over the past five years.
Next, on comparing with the industry net income growth, we found that Sekisui Chemical's growth is quite high when compared to the industry average growth of 5.1% in the same period, which is great to see.
Earnings growth is an important metric to consider when valuing a stock. It’s important for an investor to know whether the market has priced in the company's expected earnings growth (or decline). By doing so, they will have an idea if the stock is headed into clear blue waters or if swampy waters await. What is 4204 worth today? The intrinsic value infographic in our free research report helps visualize whether 4204 is currently mispriced by the market.
Is Sekisui Chemical Using Its Retained Earnings Effectively?
With a three-year median payout ratio of 39% (implying that the company retains 61% of its profits), it seems that Sekisui Chemical is reinvesting efficiently in a way that it sees respectable amount growth in its earnings and pays a dividend that's well covered.
Additionally, Sekisui Chemical has paid dividends over a period of at least ten years which means that the company is pretty serious about sharing its profits with shareholders.
Conclusion
Overall, we are quite pleased with Sekisui Chemical's performance. In particular, it's great to see that the company is investing heavily into its business and along with a high rate of return, that has resulted in a sizeable growth in its earnings. With that said, the latest industry analyst forecasts reveal that the company's earnings growth is expected to slow down. Are these analysts expectations based on the broad expectations for the industry, or on the company's fundamentals? Click here to be taken to our analyst's forecasts page for the company.
Valuation is complex, but we're helping make it simple.
Find out whether Sekisui Chemical is potentially over or undervalued by checking out our comprehensive analysis, which includes fair value estimates, risks and warnings, dividends, insider transactions and financial health.
View the Free AnalysisHave feedback on this article? Concerned about the content? Get in touch with us directly. Alternatively, email editorial-team (at) simplywallst.com.
This article by Simply Wall St is general in nature. We provide commentary based on historical data and analyst forecasts only using an unbiased methodology and our articles are not intended to be financial advice. It does not constitute a recommendation to buy or sell any stock, and does not take account of your objectives, or your financial situation. We aim to bring you long-term focused analysis driven by fundamental data. Note that our analysis may not factor in the latest price-sensitive company announcements or qualitative material. Simply Wall St has no position in any stocks mentioned.
About TSE:4204
Sekisui Chemical
Engages in the housing, urban infrastructure and environmental products, high performance plastics, and medical businesses.
Solid track record with excellent balance sheet and pays a dividend.

