Stock Analysis
- Japan
- /
- Electrical
- /
- TSE:5803
Are Robust Financials Driving The Recent Rally In Fujikura Ltd.'s (TSE:5803) Stock?

Fujikura's (TSE:5803) stock is up by a considerable 123% over the past three months. Given that the market rewards strong financials in the long-term, we wonder if that is the case in this instance. Specifically, we decided to study Fujikura's ROE in this article.
ROE or return on equity is a useful tool to assess how effectively a company can generate returns on the investment it received from its shareholders. In other words, it is a profitability ratio which measures the rate of return on the capital provided by the company's shareholders.
View our latest analysis for Fujikura
How To Calculate Return On Equity?
The formula for return on equity is:
Return on Equity = Net Profit (from continuing operations) ÷ Shareholders' Equity
So, based on the above formula, the ROE for Fujikura is:
9.6% = JP¥32b ÷ JP¥336b (Based on the trailing twelve months to December 2023).
The 'return' is the amount earned after tax over the last twelve months. That means that for every ¥1 worth of shareholders' equity, the company generated ¥0.10 in profit.
What Has ROE Got To Do With Earnings Growth?
We have already established that ROE serves as an efficient profit-generating gauge for a company's future earnings. We now need to evaluate how much profit the company reinvests or "retains" for future growth which then gives us an idea about the growth potential of the company. Assuming all else is equal, companies that have both a higher return on equity and higher profit retention are usually the ones that have a higher growth rate when compared to companies that don't have the same features.
Fujikura's Earnings Growth And 9.6% ROE
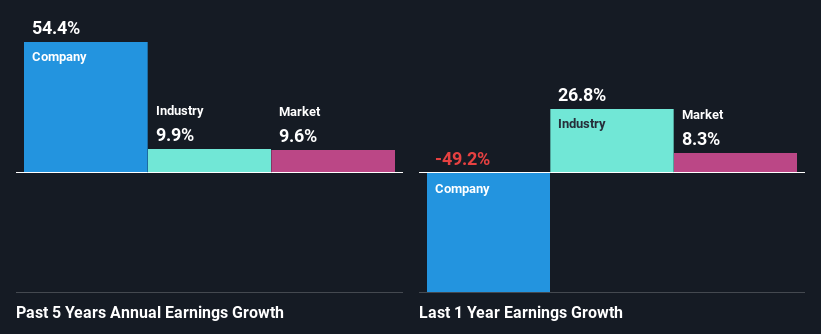
To begin with, Fujikura seems to have a respectable ROE. Further, the company's ROE compares quite favorably to the industry average of 7.8%. This probably laid the ground for Fujikura's significant 54% net income growth seen over the past five years. We believe that there might also be other aspects that are positively influencing the company's earnings growth. Such as - high earnings retention or an efficient management in place.
Next, on comparing with the industry net income growth, we found that Fujikura's growth is quite high when compared to the industry average growth of 9.9% in the same period, which is great to see.
Earnings growth is an important metric to consider when valuing a stock. It’s important for an investor to know whether the market has priced in the company's expected earnings growth (or decline). By doing so, they will have an idea if the stock is headed into clear blue waters or if swampy waters await. Is 5803 fairly valued? This infographic on the company's intrinsic value has everything you need to know.
Is Fujikura Using Its Retained Earnings Effectively?
Fujikura has a really low three-year median payout ratio of 12%, meaning that it has the remaining 88% left over to reinvest into its business. So it looks like Fujikura is reinvesting profits heavily to grow its business, which shows in its earnings growth.
Besides, Fujikura has been paying dividends for at least ten years or more. This shows that the company is committed to sharing profits with its shareholders.
Summary
In total, we are pretty happy with Fujikura's performance. Particularly, we like that the company is reinvesting heavily into its business, and at a high rate of return. Unsurprisingly, this has led to an impressive earnings growth. Having said that, the company's earnings growth is expected to slow down, as forecasted in the current analyst estimates. To know more about the latest analysts predictions for the company, check out this visualization of analyst forecasts for the company.
Valuation is complex, but we're helping make it simple.
Find out whether Fujikura is potentially over or undervalued by checking out our comprehensive analysis, which includes fair value estimates, risks and warnings, dividends, insider transactions and financial health.
View the Free AnalysisHave feedback on this article? Concerned about the content? Get in touch with us directly. Alternatively, email editorial-team (at) simplywallst.com.
This article by Simply Wall St is general in nature. We provide commentary based on historical data and analyst forecasts only using an unbiased methodology and our articles are not intended to be financial advice. It does not constitute a recommendation to buy or sell any stock, and does not take account of your objectives, or your financial situation. We aim to bring you long-term focused analysis driven by fundamental data. Note that our analysis may not factor in the latest price-sensitive company announcements or qualitative material. Simply Wall St has no position in any stocks mentioned.
About TSE:5803
Fujikura
Engages in energy, telecommunications, electronics, automotive, and real estate businesses in Japan, the United States, China, and internationally.
Flawless balance sheet average dividend payer.

