Stock Analysis
Despite shrinking by Kr10b in the past week, Brim hf (ICE:BRIM) shareholders are still up 195% over 5 years

When you buy shares in a company, it's worth keeping in mind the possibility that it could fail, and you could lose your money. But when you pick a company that is really flourishing, you can make more than 100%. One great example is Brim hf. (ICE:BRIM) which saw its share price drive 156% higher over five years. Unfortunately, though, the stock has dropped 6.1% over a week. But this could be related to the soft market, with stocks selling off around 1.3% in the last week.
While this past week has detracted from the company's five-year return, let's look at the recent trends of the underlying business and see if the gains have been in alignment.
See our latest analysis for Brim hf
To quote Buffett, 'Ships will sail around the world but the Flat Earth Society will flourish. There will continue to be wide discrepancies between price and value in the marketplace...' By comparing earnings per share (EPS) and share price changes over time, we can get a feel for how investor attitudes to a company have morphed over time.
During the last half decade, Brim hf became profitable. That kind of transition can be an inflection point that justifies a strong share price gain, just as we have seen here.
You can see how EPS has changed over time in the image below (click on the chart to see the exact values).
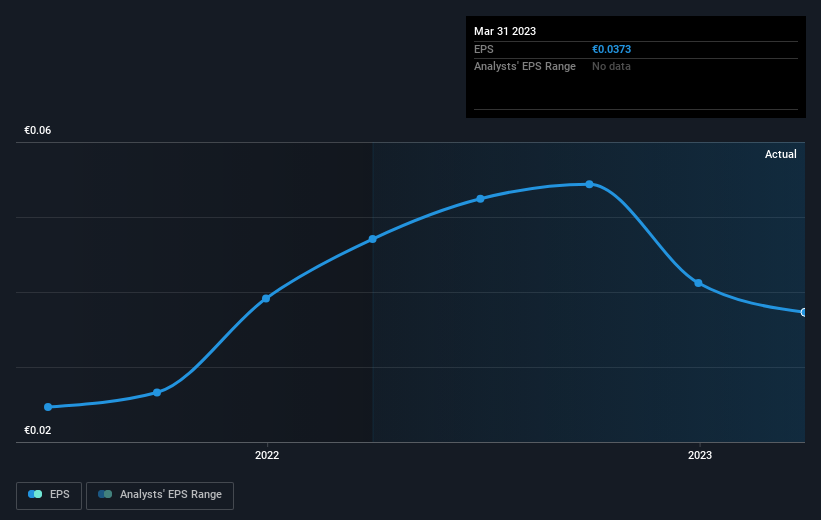
Dive deeper into Brim hf's key metrics by checking this interactive graph of Brim hf's earnings, revenue and cash flow.
What About Dividends?
It is important to consider the total shareholder return, as well as the share price return, for any given stock. The TSR is a return calculation that accounts for the value of cash dividends (assuming that any dividend received was reinvested) and the calculated value of any discounted capital raisings and spin-offs. Arguably, the TSR gives a more comprehensive picture of the return generated by a stock. In the case of Brim hf, it has a TSR of 195% for the last 5 years. That exceeds its share price return that we previously mentioned. And there's no prize for guessing that the dividend payments largely explain the divergence!
A Different Perspective
While the broader market lost about 7.4% in the twelve months, Brim hf shareholders did even worse, losing 16% (even including dividends). However, it could simply be that the share price has been impacted by broader market jitters. It might be worth keeping an eye on the fundamentals, in case there's a good opportunity. On the bright side, long term shareholders have made money, with a gain of 24% per year over half a decade. It could be that the recent sell-off is an opportunity, so it may be worth checking the fundamental data for signs of a long term growth trend. While it is well worth considering the different impacts that market conditions can have on the share price, there are other factors that are even more important. Consider risks, for instance. Every company has them, and we've spotted 3 warning signs for Brim hf you should know about.
If you would prefer to check out another company -- one with potentially superior financials -- then do not miss this free list of companies that have proven they can grow earnings.
Please note, the market returns quoted in this article reflect the market weighted average returns of stocks that currently trade on Icelandic exchanges.
Valuation is complex, but we're helping make it simple.
Find out whether Brim hf is potentially over or undervalued by checking out our comprehensive analysis, which includes fair value estimates, risks and warnings, dividends, insider transactions and financial health.
View the Free AnalysisHave feedback on this article? Concerned about the content? Get in touch with us directly. Alternatively, email editorial-team (at) simplywallst.com.
This article by Simply Wall St is general in nature. We provide commentary based on historical data and analyst forecasts only using an unbiased methodology and our articles are not intended to be financial advice. It does not constitute a recommendation to buy or sell any stock, and does not take account of your objectives, or your financial situation. We aim to bring you long-term focused analysis driven by fundamental data. Note that our analysis may not factor in the latest price-sensitive company announcements or qualitative material. Simply Wall St has no position in any stocks mentioned.
About ICSE:BRIM
Brim hf
Engages in the fishing, processing, and marketing of ground fish and pelagic fish in Iceland.
Mediocre balance sheet second-rate dividend payer.

