Stock Analysis
- India
- /
- Capital Markets
- /
- NSEI:JMFINANCIL
JM Financial (NSE:JMFINANCIL) shareholders notch a 48% return over 1 year, yet earnings have been shrinking


While JM Financial Limited (NSE:JMFINANCIL) shareholders are probably generally happy, the stock hasn't had particularly good run recently, with the share price falling 21% in the last quarter. But at least the stock is up over the last year. However, its return of 46% does fall short of the market return of, 49%.
On the back of a solid 7-day performance, let's check what role the company's fundamentals have played in driving long term shareholder returns.
View our latest analysis for JM Financial
In his essay The Superinvestors of Graham-and-Doddsville Warren Buffett described how share prices do not always rationally reflect the value of a business. One imperfect but simple way to consider how the market perception of a company has shifted is to compare the change in the earnings per share (EPS) with the share price movement.
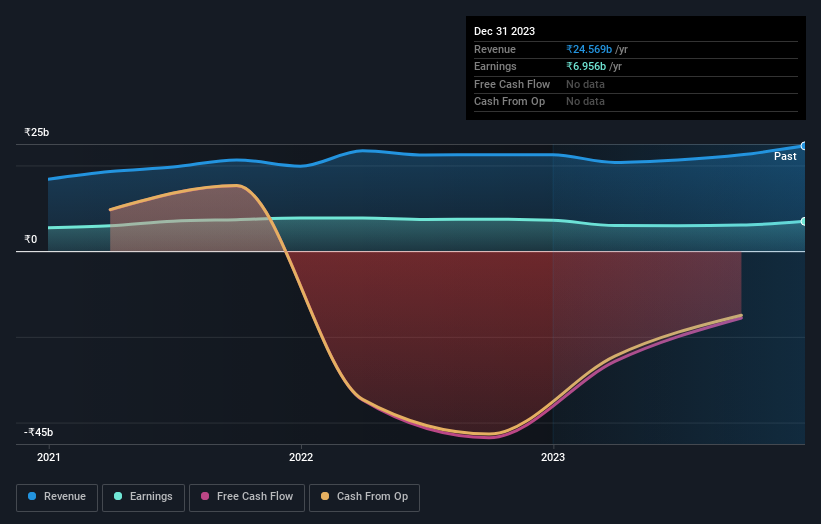
Over the last twelve months, JM Financial actually shrank its EPS by 3.3%.
Sometimes companies will sacrifice EPS in the short term for longer term gains; and in that case we may be able to find other positives. It makes sense to check some of the other fundamental data for an explanation of the share price rise.
We think that the revenue growth of 9.3% could have some investors interested. We do see some companies suppress earnings in order to accelerate revenue growth.
The company's revenue and earnings (over time) are depicted in the image below (click to see the exact numbers).
This free interactive report on JM Financial's balance sheet strength is a great place to start, if you want to investigate the stock further.
What About Dividends?
When looking at investment returns, it is important to consider the difference between total shareholder return (TSR) and share price return. The TSR incorporates the value of any spin-offs or discounted capital raisings, along with any dividends, based on the assumption that the dividends are reinvested. It's fair to say that the TSR gives a more complete picture for stocks that pay a dividend. In the case of JM Financial, it has a TSR of 48% for the last 1 year. That exceeds its share price return that we previously mentioned. The dividends paid by the company have thusly boosted the total shareholder return.
A Different Perspective
JM Financial shareholders have received returns of 48% over twelve months (even including dividends), which isn't far from the general market return. Most would be happy with a gain, and it helps that the year's return is actually better than the average return over five years, which was 2%. It is possible that management foresight will bring growth well into the future, even if the share price slows down. While it is well worth considering the different impacts that market conditions can have on the share price, there are other factors that are even more important. Take risks, for example - JM Financial has 2 warning signs (and 1 which is a bit concerning) we think you should know about.
Of course JM Financial may not be the best stock to buy. So you may wish to see this free collection of growth stocks.
Please note, the market returns quoted in this article reflect the market weighted average returns of stocks that currently trade on Indian exchanges.
Valuation is complex, but we're helping make it simple.
Find out whether JM Financial is potentially over or undervalued by checking out our comprehensive analysis, which includes fair value estimates, risks and warnings, dividends, insider transactions and financial health.
View the Free AnalysisHave feedback on this article? Concerned about the content? Get in touch with us directly. Alternatively, email editorial-team (at) simplywallst.com.
This article by Simply Wall St is general in nature. We provide commentary based on historical data and analyst forecasts only using an unbiased methodology and our articles are not intended to be financial advice. It does not constitute a recommendation to buy or sell any stock, and does not take account of your objectives, or your financial situation. We aim to bring you long-term focused analysis driven by fundamental data. Note that our analysis may not factor in the latest price-sensitive company announcements or qualitative material. Simply Wall St has no position in any stocks mentioned.
About NSEI:JMFINANCIL
JM Financial
Provides various integrated and diversified financial services to corporations, financial institutions, high net-worth individuals, and retail customers in India.
Average dividend payer with mediocre balance sheet.

