Stock Analysis
- Hong Kong
- /
- Tech Hardware
- /
- SEHK:1263
Despite the downward trend in earnings at PC Partner Group (HKG:1263) the stock pops 11%, bringing five-year gains to 165%


Stock pickers are generally looking for stocks that will outperform the broader market. Buying under-rated businesses is one path to excess returns. For example, the PC Partner Group Limited (HKG:1263) share price is up 55% in the last 5 years, clearly besting the market decline of around 15% (ignoring dividends).
Since it's been a strong week for PC Partner Group shareholders, let's have a look at trend of the longer term fundamentals.
Check out our latest analysis for PC Partner Group
While the efficient markets hypothesis continues to be taught by some, it has been proven that markets are over-reactive dynamic systems, and investors are not always rational. By comparing earnings per share (EPS) and share price changes over time, we can get a feel for how investor attitudes to a company have morphed over time.
During five years of share price growth, PC Partner Group actually saw its EPS drop 25% per year.
Essentially, it doesn't seem likely that investors are focused on EPS. Because earnings per share don't seem to match up with the share price, we'll take a look at other metrics instead.
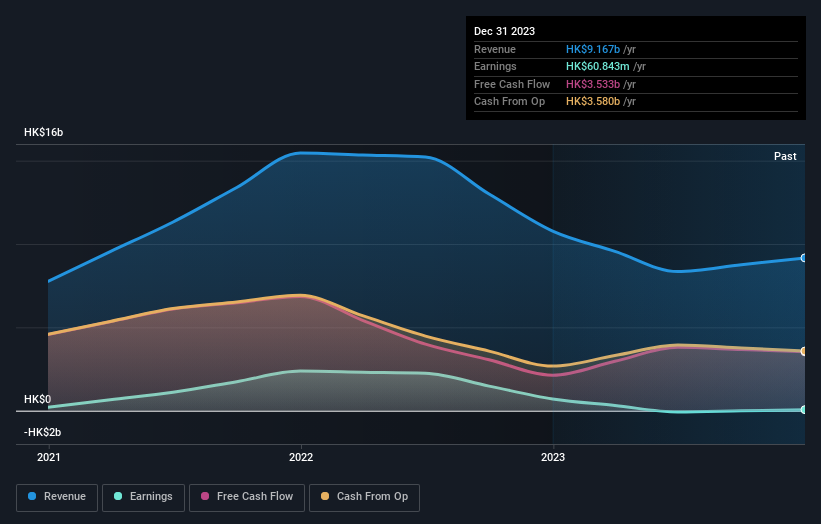
We note that the dividend is higher than it was previously - always nice to see. It could be that the company is reaching maturity and dividend investors are buying for the yield. We'd posit that the revenue growth over the last five years, of 8.0% per year, would encourage people to invest.
You can see below how earnings and revenue have changed over time (discover the exact values by clicking on the image).
Take a more thorough look at PC Partner Group's financial health with this free report on its balance sheet.
What About Dividends?
As well as measuring the share price return, investors should also consider the total shareholder return (TSR). The TSR is a return calculation that accounts for the value of cash dividends (assuming that any dividend received was reinvested) and the calculated value of any discounted capital raisings and spin-offs. Arguably, the TSR gives a more comprehensive picture of the return generated by a stock. In the case of PC Partner Group, it has a TSR of 165% for the last 5 years. That exceeds its share price return that we previously mentioned. And there's no prize for guessing that the dividend payments largely explain the divergence!
A Different Perspective
While the broader market lost about 3.5% in the twelve months, PC Partner Group shareholders did even worse, losing 25% (even including dividends). However, it could simply be that the share price has been impacted by broader market jitters. It might be worth keeping an eye on the fundamentals, in case there's a good opportunity. On the bright side, long term shareholders have made money, with a gain of 22% per year over half a decade. If the fundamental data continues to indicate long term sustainable growth, the current sell-off could be an opportunity worth considering. It's always interesting to track share price performance over the longer term. But to understand PC Partner Group better, we need to consider many other factors. Even so, be aware that PC Partner Group is showing 2 warning signs in our investment analysis , you should know about...
Of course, you might find a fantastic investment by looking elsewhere. So take a peek at this free list of companies we expect will grow earnings.
Please note, the market returns quoted in this article reflect the market weighted average returns of stocks that currently trade on Hong Kong exchanges.
Valuation is complex, but we're helping make it simple.
Find out whether PC Partner Group is potentially over or undervalued by checking out our comprehensive analysis, which includes fair value estimates, risks and warnings, dividends, insider transactions and financial health.
View the Free AnalysisHave feedback on this article? Concerned about the content? Get in touch with us directly. Alternatively, email editorial-team (at) simplywallst.com.
This article by Simply Wall St is general in nature. We provide commentary based on historical data and analyst forecasts only using an unbiased methodology and our articles are not intended to be financial advice. It does not constitute a recommendation to buy or sell any stock, and does not take account of your objectives, or your financial situation. We aim to bring you long-term focused analysis driven by fundamental data. Note that our analysis may not factor in the latest price-sensitive company announcements or qualitative material. Simply Wall St has no position in any stocks mentioned.
About SEHK:1263
PC Partner Group
An investment holding company, designs, develops, manufactures, and sells computer electronics.
Flawless balance sheet, good value and pays a dividend.

