Stock Analysis
The past five years for China Dongxiang (Group) (HKG:3818) investors has not been profitable


While not a mind-blowing move, it is good to see that the China Dongxiang (Group) Co., Ltd. (HKG:3818) share price has gained 26% in the last three months. But that is little comfort to those holding over the last half decade, sitting on a big loss. Indeed, the share price is down 66% in the period. Some might say the recent bounce is to be expected after such a bad drop. Of course, this could be the start of a turnaround.
Now let's have a look at the company's fundamentals, and see if the long term shareholder return has matched the performance of the underlying business.
Check out our latest analysis for China Dongxiang (Group)
There is no denying that markets are sometimes efficient, but prices do not always reflect underlying business performance. One flawed but reasonable way to assess how sentiment around a company has changed is to compare the earnings per share (EPS) with the share price.
During five years of share price growth, China Dongxiang (Group) moved from a loss to profitability. That would generally be considered a positive, so we are surprised to see the share price is down. Other metrics might give us a better handle on how its value is changing over time.
The modest 1.4% dividend yield is unlikely to be guiding the market view of the stock. In contrast to the share price, revenue has actually increased by 1.6% a year in the five year period. A more detailed examination of the revenue and earnings may or may not explain why the share price languishes; there could be an opportunity.
The company's revenue and earnings (over time) are depicted in the image below (click to see the exact numbers).
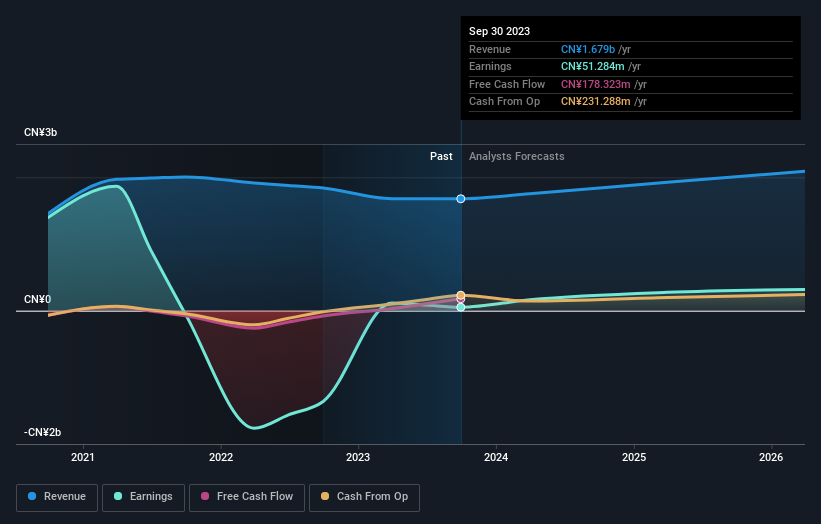
We know that China Dongxiang (Group) has improved its bottom line lately, but what does the future have in store? You can see what analysts are predicting for China Dongxiang (Group) in this interactive graph of future profit estimates.
What About Dividends?
When looking at investment returns, it is important to consider the difference between total shareholder return (TSR) and share price return. Whereas the share price return only reflects the change in the share price, the TSR includes the value of dividends (assuming they were reinvested) and the benefit of any discounted capital raising or spin-off. It's fair to say that the TSR gives a more complete picture for stocks that pay a dividend. We note that for China Dongxiang (Group) the TSR over the last 5 years was -53%, which is better than the share price return mentioned above. This is largely a result of its dividend payments!
A Different Perspective
It's nice to see that China Dongxiang (Group) shareholders have received a total shareholder return of 28% over the last year. And that does include the dividend. There's no doubt those recent returns are much better than the TSR loss of 9% per year over five years. We generally put more weight on the long term performance over the short term, but the recent improvement could hint at a (positive) inflection point within the business. It's always interesting to track share price performance over the longer term. But to understand China Dongxiang (Group) better, we need to consider many other factors. Even so, be aware that China Dongxiang (Group) is showing 1 warning sign in our investment analysis , you should know about...
If you are like me, then you will not want to miss this free list of growing companies that insiders are buying.
Please note, the market returns quoted in this article reflect the market weighted average returns of stocks that currently trade on Hong Kong exchanges.
Valuation is complex, but we're helping make it simple.
Find out whether China Dongxiang (Group) is potentially over or undervalued by checking out our comprehensive analysis, which includes fair value estimates, risks and warnings, dividends, insider transactions and financial health.
View the Free AnalysisHave feedback on this article? Concerned about the content? Get in touch with us directly. Alternatively, email editorial-team (at) simplywallst.com.
This article by Simply Wall St is general in nature. We provide commentary based on historical data and analyst forecasts only using an unbiased methodology and our articles are not intended to be financial advice. It does not constitute a recommendation to buy or sell any stock, and does not take account of your objectives, or your financial situation. We aim to bring you long-term focused analysis driven by fundamental data. Note that our analysis may not factor in the latest price-sensitive company announcements or qualitative material. Simply Wall St has no position in any stocks mentioned.
About SEHK:3818
China Dongxiang (Group)
Designs, develops, markets, and sells sport-related apparel, footwear, and accessories in the People’s Republic of China and internationally.
Flawless balance sheet with reasonable growth potential.

