Stock Analysis
Dream International (HKG:1126) stock performs better than its underlying earnings growth over last three years


By buying an index fund, investors can approximate the average market return. But if you pick the right individual stocks, you could make more than that. For example, Dream International Limited (HKG:1126) shareholders have seen the share price rise 56% over three years, well in excess of the market decline (29%, not including dividends). On the other hand, the returns haven't been quite so good recently, with shareholders up just 21% , including dividends .
The past week has proven to be lucrative for Dream International investors, so let's see if fundamentals drove the company's three-year performance.
See our latest analysis for Dream International
To quote Buffett, 'Ships will sail around the world but the Flat Earth Society will flourish. There will continue to be wide discrepancies between price and value in the marketplace...' One flawed but reasonable way to assess how sentiment around a company has changed is to compare the earnings per share (EPS) with the share price.
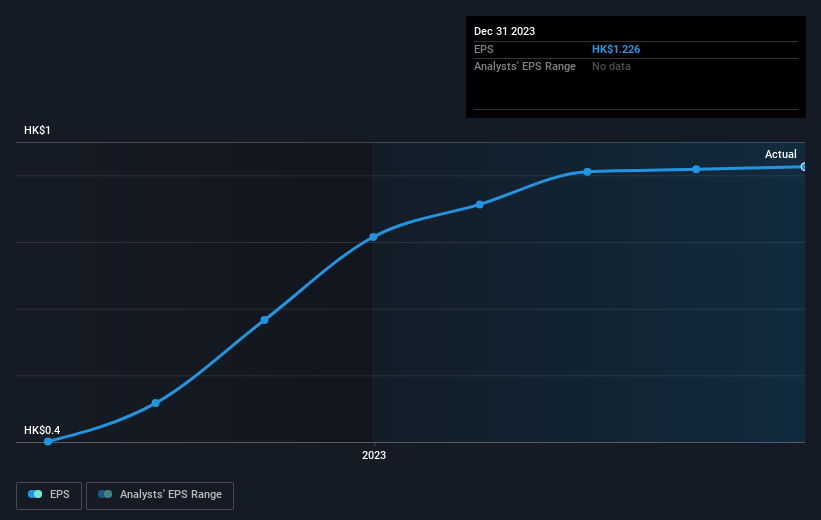
During three years of share price growth, Dream International achieved compound earnings per share growth of 45% per year. This EPS growth is higher than the 16% average annual increase in the share price. So one could reasonably conclude that the market has cooled on the stock. This cautious sentiment is reflected in its (fairly low) P/E ratio of 4.00.
You can see how EPS has changed over time in the image below (click on the chart to see the exact values).
This free interactive report on Dream International's earnings, revenue and cash flow is a great place to start, if you want to investigate the stock further.
What About Dividends?
As well as measuring the share price return, investors should also consider the total shareholder return (TSR). The TSR is a return calculation that accounts for the value of cash dividends (assuming that any dividend received was reinvested) and the calculated value of any discounted capital raisings and spin-offs. Arguably, the TSR gives a more comprehensive picture of the return generated by a stock. In the case of Dream International, it has a TSR of 97% for the last 3 years. That exceeds its share price return that we previously mentioned. The dividends paid by the company have thusly boosted the total shareholder return.
A Different Perspective
It's good to see that Dream International has rewarded shareholders with a total shareholder return of 21% in the last twelve months. That's including the dividend. Since the one-year TSR is better than the five-year TSR (the latter coming in at 10% per year), it would seem that the stock's performance has improved in recent times. Someone with an optimistic perspective could view the recent improvement in TSR as indicating that the business itself is getting better with time. While it is well worth considering the different impacts that market conditions can have on the share price, there are other factors that are even more important. Even so, be aware that Dream International is showing 1 warning sign in our investment analysis , you should know about...
But note: Dream International may not be the best stock to buy. So take a peek at this free list of interesting companies with past earnings growth (and further growth forecast).
Please note, the market returns quoted in this article reflect the market weighted average returns of stocks that currently trade on Hong Kong exchanges.
Valuation is complex, but we're helping make it simple.
Find out whether Dream International is potentially over or undervalued by checking out our comprehensive analysis, which includes fair value estimates, risks and warnings, dividends, insider transactions and financial health.
View the Free AnalysisHave feedback on this article? Concerned about the content? Get in touch with us directly. Alternatively, email editorial-team (at) simplywallst.com.
This article by Simply Wall St is general in nature. We provide commentary based on historical data and analyst forecasts only using an unbiased methodology and our articles are not intended to be financial advice. It does not constitute a recommendation to buy or sell any stock, and does not take account of your objectives, or your financial situation. We aim to bring you long-term focused analysis driven by fundamental data. Note that our analysis may not factor in the latest price-sensitive company announcements or qualitative material. Simply Wall St has no position in any stocks mentioned.
About SEHK:1126
Dream International
An investment holding company, designs, develops, manufactures, sells, and trades in plush stuffed toys, plastic figures, dolls, die-casting, and tarpaulin products in Hong Kong, North America, Japan, Europe, the People’s Republic of China, Vietnam, Korea, and internationally.
Flawless balance sheet with solid track record and pays a dividend.

