Stock Analysis


Buying shares in the best businesses can build meaningful wealth for you and your family. While not every stock performs well, when investors win, they can win big. For example, the Triad Group plc (LON:TRD) share price is up a whopping 640% in the last half decade, a handsome return for long term holders. And this is just one example of the epic gains achieved by some long term investors. It's also good to see the share price up 44% over the last quarter. Anyone who held for that rewarding ride would probably be keen to talk about it.
Since it's been a strong week for Triad Group shareholders, let's have a look at trend of the longer term fundamentals.
View our latest analysis for Triad Group
Because Triad Group made a loss in the last twelve months, we think the market is probably more focussed on revenue and revenue growth, at least for now. When a company doesn't make profits, we'd generally hope to see good revenue growth. Some companies are willing to postpone profitability to grow revenue faster, but in that case one would hope for good top-line growth to make up for the lack of earnings.
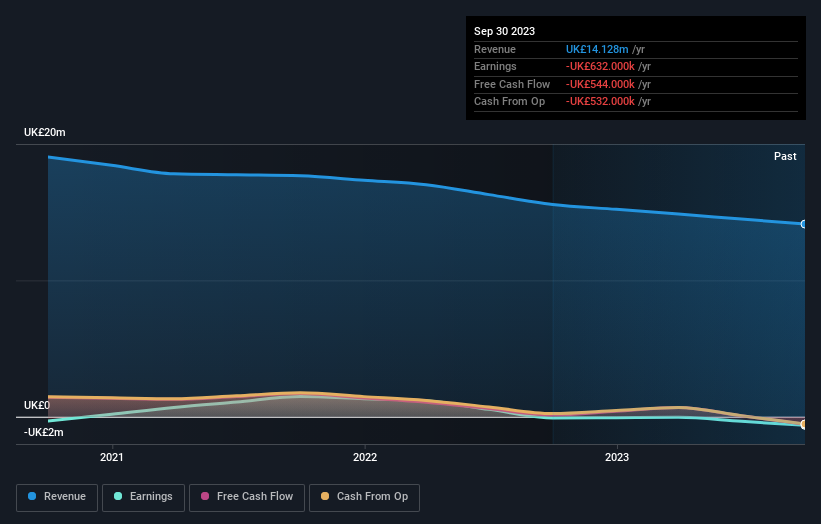
In the last 5 years Triad Group saw its revenue shrink by 10% per year. So it's pretty surprising to see that the share price is up 49% per year. There can be no doubt this kind of decoupling of revenue growth and share price growth is unusual to see in loss making companies. At the risk of upsetting holders, this does suggest that hope for a better future is playing a significant role in the share price action.
You can see how earnings and revenue have changed over time in the image below (click on the chart to see the exact values).
If you are thinking of buying or selling Triad Group stock, you should check out this FREE detailed report on its balance sheet.
What About Dividends?
It is important to consider the total shareholder return, as well as the share price return, for any given stock. Whereas the share price return only reflects the change in the share price, the TSR includes the value of dividends (assuming they were reinvested) and the benefit of any discounted capital raising or spin-off. So for companies that pay a generous dividend, the TSR is often a lot higher than the share price return. In the case of Triad Group, it has a TSR of 799% for the last 5 years. That exceeds its share price return that we previously mentioned. This is largely a result of its dividend payments!
A Different Perspective
It's good to see that Triad Group has rewarded shareholders with a total shareholder return of 98% in the last twelve months. That's including the dividend. Since the one-year TSR is better than the five-year TSR (the latter coming in at 55% per year), it would seem that the stock's performance has improved in recent times. In the best case scenario, this may hint at some real business momentum, implying that now could be a great time to delve deeper. It's always interesting to track share price performance over the longer term. But to understand Triad Group better, we need to consider many other factors. Take risks, for example - Triad Group has 2 warning signs (and 1 which is a bit concerning) we think you should know about.
If you like to buy stocks alongside management, then you might just love this free list of companies. (Hint: insiders have been buying them).
Please note, the market returns quoted in this article reflect the market weighted average returns of stocks that currently trade on British exchanges.
Valuation is complex, but we're helping make it simple.
Find out whether Triad Group is potentially over or undervalued by checking out our comprehensive analysis, which includes fair value estimates, risks and warnings, dividends, insider transactions and financial health.
View the Free AnalysisHave feedback on this article? Concerned about the content? Get in touch with us directly. Alternatively, email editorial-team (at) simplywallst.com.
This article by Simply Wall St is general in nature. We provide commentary based on historical data and analyst forecasts only using an unbiased methodology and our articles are not intended to be financial advice. It does not constitute a recommendation to buy or sell any stock, and does not take account of your objectives, or your financial situation. We aim to bring you long-term focused analysis driven by fundamental data. Note that our analysis may not factor in the latest price-sensitive company announcements or qualitative material. Simply Wall St has no position in any stocks mentioned.
About LSE:TRD
Triad Group
Provides information technology consultancy services to the public, private, and not-for-profit sectors primarily in the United Kingdom.
Flawless balance sheet not a dividend payer.

