Stock Analysis
- France
- /
- Real Estate
- /
- ENXTPA:NXI
Nexity's (EPA:NXI) earnings have declined over three years, contributing to shareholders 70% loss


Nexity SA (EPA:NXI) shareholders should be happy to see the share price up 13% in the last month. But that doesn't change the fact that the returns over the last three years have been stomach churning. The share price has sunk like a leaky ship, down 76% in that time. So it sure is nice to see a bit of an improvement. The thing to think about is whether the business has really turned around.
While the last three years has been tough for Nexity shareholders, this past week has shown signs of promise. So let's look at the longer term fundamentals and see if they've been the driver of the negative returns.
See our latest analysis for Nexity
While markets are a powerful pricing mechanism, share prices reflect investor sentiment, not just underlying business performance. One way to examine how market sentiment has changed over time is to look at the interaction between a company's share price and its earnings per share (EPS).
During the three years that the share price fell, Nexity's earnings per share (EPS) dropped by 45% each year. This change in EPS is reasonably close to the 38% average annual decrease in the share price. So it seems that investor expectations of the company are staying pretty steady, despite the disappointment. It seems like the share price is reflecting the declining earnings per share.
The image below shows how EPS has tracked over time (if you click on the image you can see greater detail).
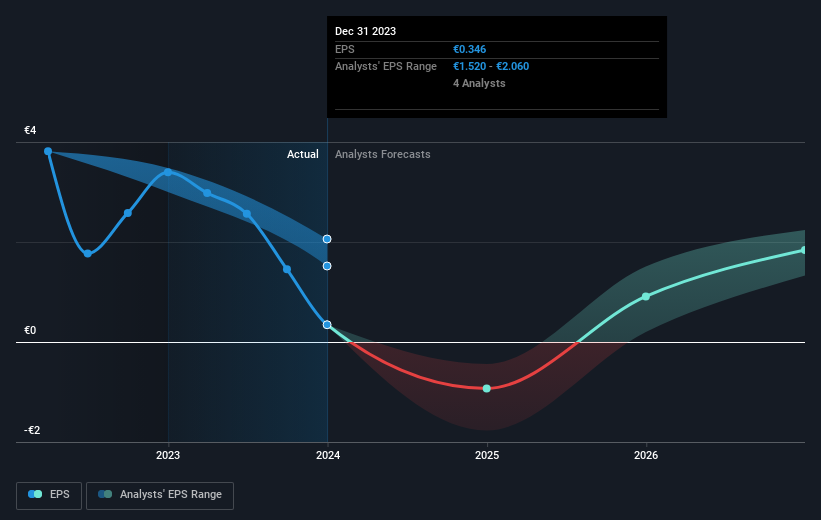
It might be well worthwhile taking a look at our free report on Nexity's earnings, revenue and cash flow.
What About The Total Shareholder Return (TSR)?
We've already covered Nexity's share price action, but we should also mention its total shareholder return (TSR). Arguably the TSR is a more complete return calculation because it accounts for the value of dividends (as if they were reinvested), along with the hypothetical value of any discounted capital that have been offered to shareholders. Dividends have been really beneficial for Nexity shareholders, and that cash payout explains why its total shareholder loss of 70%, over the last 3 years, isn't as bad as the share price return.
A Different Perspective
Investors in Nexity had a tough year, with a total loss of 50%, against a market gain of about 6.0%. Even the share prices of good stocks drop sometimes, but we want to see improvements in the fundamental metrics of a business, before getting too interested. Unfortunately, last year's performance may indicate unresolved challenges, given that it was worse than the annualised loss of 10% over the last half decade. Generally speaking long term share price weakness can be a bad sign, though contrarian investors might want to research the stock in hope of a turnaround. While it is well worth considering the different impacts that market conditions can have on the share price, there are other factors that are even more important. For instance, we've identified 4 warning signs for Nexity (1 is significant) that you should be aware of.
But note: Nexity may not be the best stock to buy. So take a peek at this free list of interesting companies with past earnings growth (and further growth forecast).
Please note, the market returns quoted in this article reflect the market weighted average returns of stocks that currently trade on French exchanges.
Valuation is complex, but we're helping make it simple.
Find out whether Nexity is potentially over or undervalued by checking out our comprehensive analysis, which includes fair value estimates, risks and warnings, dividends, insider transactions and financial health.
View the Free AnalysisHave feedback on this article? Concerned about the content? Get in touch with us directly. Alternatively, email editorial-team (at) simplywallst.com.
This article by Simply Wall St is general in nature. We provide commentary based on historical data and analyst forecasts only using an unbiased methodology and our articles are not intended to be financial advice. It does not constitute a recommendation to buy or sell any stock, and does not take account of your objectives, or your financial situation. We aim to bring you long-term focused analysis driven by fundamental data. Note that our analysis may not factor in the latest price-sensitive company announcements or qualitative material. Simply Wall St has no position in any stocks mentioned.
About ENXTPA:NXI
Moderate growth potential and slightly overvalued.

