Stock Analysis
The three-year shareholder returns and company earnings persist lower as Siili Solutions Oyj (HEL:SIILI) stock falls a further 12% in past week


For many investors, the main point of stock picking is to generate higher returns than the overall market. But in any portfolio, there are likely to be some stocks that fall short of that benchmark. Unfortunately, that's been the case for longer term Siili Solutions Oyj (HEL:SIILI) shareholders, since the share price is down 49% in the last three years, falling well short of the market decline of around 15%. And more recent buyers are having a tough time too, with a drop of 48% in the last year. The falls have accelerated recently, with the share price down 12% in the last three months.
Given the past week has been tough on shareholders, let's investigate the fundamentals and see what we can learn.
See our latest analysis for Siili Solutions Oyj
While the efficient markets hypothesis continues to be taught by some, it has been proven that markets are over-reactive dynamic systems, and investors are not always rational. One way to examine how market sentiment has changed over time is to look at the interaction between a company's share price and its earnings per share (EPS).
During the three years that the share price fell, Siili Solutions Oyj's earnings per share (EPS) dropped by 0.8% each year. This reduction in EPS is slower than the 20% annual reduction in the share price. So it's likely that the EPS decline has disappointed the market, leaving investors hesitant to buy.
The company's earnings per share (over time) is depicted in the image below (click to see the exact numbers).
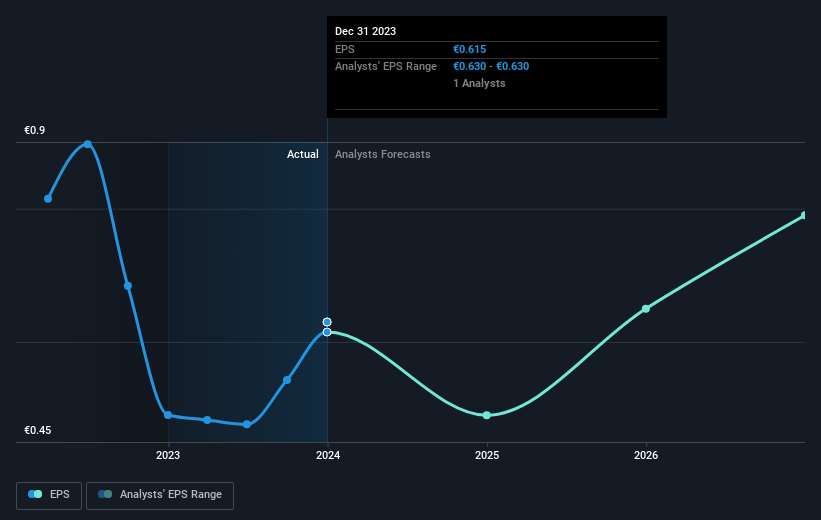
We know that Siili Solutions Oyj has improved its bottom line lately, but is it going to grow revenue? If you're interested, you could check this free report showing consensus revenue forecasts.
What About Dividends?
As well as measuring the share price return, investors should also consider the total shareholder return (TSR). Whereas the share price return only reflects the change in the share price, the TSR includes the value of dividends (assuming they were reinvested) and the benefit of any discounted capital raising or spin-off. It's fair to say that the TSR gives a more complete picture for stocks that pay a dividend. In the case of Siili Solutions Oyj, it has a TSR of -46% for the last 3 years. That exceeds its share price return that we previously mentioned. And there's no prize for guessing that the dividend payments largely explain the divergence!
A Different Perspective
While the broader market lost about 6.9% in the twelve months, Siili Solutions Oyj shareholders did even worse, losing 46% (even including dividends). However, it could simply be that the share price has been impacted by broader market jitters. It might be worth keeping an eye on the fundamentals, in case there's a good opportunity. On the bright side, long term shareholders have made money, with a gain of 0.5% per year over half a decade. If the fundamental data continues to indicate long term sustainable growth, the current sell-off could be an opportunity worth considering. It's always interesting to track share price performance over the longer term. But to understand Siili Solutions Oyj better, we need to consider many other factors. Even so, be aware that Siili Solutions Oyj is showing 2 warning signs in our investment analysis , you should know about...
Of course, you might find a fantastic investment by looking elsewhere. So take a peek at this free list of companies we expect will grow earnings.
Please note, the market returns quoted in this article reflect the market weighted average returns of stocks that currently trade on Finnish exchanges.
Valuation is complex, but we're helping make it simple.
Find out whether Siili Solutions Oyj is potentially over or undervalued by checking out our comprehensive analysis, which includes fair value estimates, risks and warnings, dividends, insider transactions and financial health.
View the Free AnalysisHave feedback on this article? Concerned about the content? Get in touch with us directly. Alternatively, email editorial-team (at) simplywallst.com.
This article by Simply Wall St is general in nature. We provide commentary based on historical data and analyst forecasts only using an unbiased methodology and our articles are not intended to be financial advice. It does not constitute a recommendation to buy or sell any stock, and does not take account of your objectives, or your financial situation. We aim to bring you long-term focused analysis driven by fundamental data. Note that our analysis may not factor in the latest price-sensitive company announcements or qualitative material. Simply Wall St has no position in any stocks mentioned.
About HLSE:SIILI
Siili Solutions Oyj
Plans, develops, and maintains digital services in Finland and internationally.
Flawless balance sheet, undervalued and pays a dividend.

