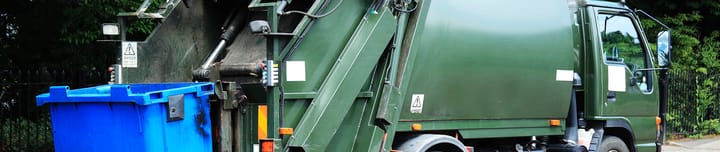
Polish (WIG) Environmental and Facilities Services Industry Analysis
UpdatedMay 16, 2024
DataAggregated Company Financials
Companies8
- 7D-0.7%
- 3M2.2%
- 1Y9.7%
- YTDn/a
Over the last 7 days, the Environmental and Facilities Services industry has remained flat, although notably DB Energy declined by 5.9%. The past year has been better, since the industry has gained 11% in that time. As for the next few years, earnings are expected to grow by 17% per annum.
Industry Valuation and Performance
Has the Polish Environmental and Facilities Services Industry valuation changed over the past few years?
| Date | Market Cap | Revenue | Earnings | PE | Absolute PE | PS |
|---|---|---|---|---|---|---|
| Thu, 16 May 2024 | zł2.1b | zł1.6b | zł218.9m | 9.7x | 9.8x | 1.3x |
| Sat, 13 Apr 2024 | zł2.2b | zł1.7b | zł231.1m | 9.7x | 9.3x | 1.3x |
| Mon, 11 Mar 2024 | zł2.1b | zł1.7b | zł234.3m | 12.4x | 8.9x | 1.2x |
| Wed, 07 Feb 2024 | zł2.2b | zł1.7b | zł224.0m | 13.5x | 9.6x | 1.3x |
| Fri, 05 Jan 2024 | zł2.6b | zł1.8b | zł235.4m | 14.7x | 11x | 1.4x |
| Sun, 03 Dec 2023 | zł2.5b | zł1.8b | zł237.6m | 13x | 10.4x | 1.4x |
| Tue, 31 Oct 2023 | zł2.4b | zł1.9b | zł246.7m | 11.3x | 9.6x | 1.3x |
| Thu, 28 Sep 2023 | zł2.3b | zł1.9b | zł247.4m | 10.8x | 9.3x | 1.2x |
| Sat, 26 Aug 2023 | zł2.5b | zł1.9b | zł228.7m | 13.3x | 11x | 1.3x |
| Mon, 24 Jul 2023 | zł2.4b | zł1.9b | zł240.3m | 11.3x | 9.9x | 1.3x |
| Wed, 21 Jun 2023 | zł2.3b | zł1.9b | zł228.3m | 11x | 10.2x | 1.3x |
| Fri, 19 May 2023 | zł2.3b | zł1.9b | zł238.1m | 11.5x | 9.8x | 1.3x |
| Sun, 16 Apr 2023 | zł2.3b | zł1.9b | zł242.1m | 10.6x | 9.5x | 1.2x |
| Tue, 14 Mar 2023 | zł2.3b | zł1.9b | zł241.2m | 10.5x | 9.7x | 1.3x |
| Thu, 09 Feb 2023 | zł2.4b | zł2.1b | zł191.4m | 10.8x | 12.4x | 1.1x |
| Sat, 07 Jan 2023 | zł2.4b | zł2.1b | zł191.8m | 10.8x | 12.3x | 1.1x |
| Mon, 05 Dec 2022 | zł2.3b | zł2.1b | zł191.2m | 10.4x | 12x | 1.1x |
| Wed, 02 Nov 2022 | zł2.4b | zł2.0b | zł167.8m | 9.4x | 14.1x | 1.2x |
| Fri, 30 Sep 2022 | zł2.4b | zł1.9b | zł163.1m | 9.3x | 14.5x | 1.2x |
| Sun, 28 Aug 2022 | zł2.5b | zł1.9b | zł176.4m | 10x | 14.1x | 1.3x |
| Tue, 26 Jul 2022 | zł2.3b | zł1.9b | zł175.0m | 11x | 13x | 1.2x |
| Thu, 23 Jun 2022 | zł2.5b | zł1.9b | zł175.2m | 11.1x | 14.3x | 1.3x |
| Sat, 21 May 2022 | zł2.5b | zł1.8b | zł170.2m | 12.5x | 14.8x | 1.4x |
| Mon, 18 Apr 2022 | zł2.9b | zł1.8b | zł175.4m | 12.6x | 16.8x | 1.6x |
| Wed, 16 Mar 2022 | zł2.7b | zł1.8b | zł182.3m | 9.4x | 14.8x | 1.5x |
| Fri, 11 Feb 2022 | zł3.0b | zł1.7b | zł224.7m | 11.5x | 13.2x | 1.7x |
| Sun, 09 Jan 2022 | zł2.9b | zł1.8b | zł224.7m | 11.8x | 12.8x | 1.6x |
| Tue, 07 Dec 2021 | zł2.8b | zł1.8b | zł236.6m | 11.2x | 11.7x | 1.6x |
| Thu, 04 Nov 2021 | zł2.7b | zł1.7b | zł237.1m | 14.4x | 11.6x | 1.6x |
| Sat, 02 Oct 2021 | zł2.8b | zł1.7b | zł237.0m | 15.4x | 11.7x | 1.6x |
| Mon, 30 Aug 2021 | zł2.8b | zł1.6b | zł220.3m | 20.7x | 12.6x | 1.7x |
| Tue, 06 Jul 2021 | zł2.5b | zł1.6b | zł220.3m | 12.7x | 11.4x | 1.5x |
Price to Earnings Ratio
12.6x
Current Industry PE
- Investors are pessimistic on the Polish Environmental and Facilities Services industry, indicating that they anticipate long term growth rates will be lower than they have historically.
- The industry is trading at a PE ratio of 9.8x which is lower than its 3-year average PE of 11.8x.
- The industry is trading close to its 3-year average PS ratio of 1.4x.
Past Earnings Growth
- Both revenue and earnings for companies in the Environmental and Facilities Services industry have remained mostly flat over the last three years.
- This means that sales and the cost of doing business have remained relatively consistent over this period and subsequently, so have profits.
Industry Comparison
How does Polish Environmental and Facilities Services compare with similar industries?
| PL Market | 0.23% | |
| Industrials | 2.86% | |
| Commercial Services | -0.044% | |
| Environmental and Facilities Services | -0.74% | |
| Diversified Support Services | 1.96% | |
| Office Services and Supplies | 1.62% | |
| Security and Alarm Services | 0% | |
| Commercial Printing | -3.63% | |
Industry PEThere are no additional sub-industries under this industry.
Forecasted GrowthThere are no additional sub-industries under this industry.
Top Stock Gainers and Losers
Which companies have driven the market over the last 7 days?
| Company | Last Price | 7D | 1Y | Valuation | |
|---|---|---|---|---|---|
| OBL Orzel Bialy | zł34.60 | 1.8% +zł10.0m | 14.6% | PE5.4x | |
| CTS City Service | zł5.10 | 2.0% +zł3.2m | -17.7% | PE6.4x | |
| GTS Geotrans | zł7.80 | 8.3% +zł3.0m | -5.3% | PS2.6x | |
| GRC Grupa RECYKL | zł87.50 | 0.6% +zł826.0k | 54.9% | PE12.9x | |
| IVE Investeko | zł2.14 | 7.0% +zł769.9k | -40.6% | PS1.7x |