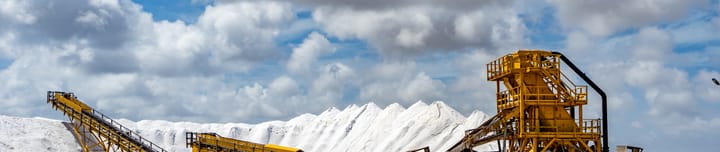
U.K. (FTSE) Diversified Metals and Mining Industry Analysis
UpdatedJun 03, 2024
DataAggregated Company Financials
Companies79
- 7D-2.5%
- 3M18.9%
- 1Y8.2%
- YTDn/a
Over the last 7 days, the Diversified Metals and Mining industry has dropped 2.5%, driven by Rio Tinto Group declining 3.2%. On the other hand Kodal Minerals is actually up 22%. In the past year, the industry has gained 7.8%. Earnings are forecast to grow by 9.6% annually.
Industry Valuation and Performance
Has the U.K. Diversified Metals and Mining Industry valuation changed over the past few years?
| Date | Market Cap | Revenue | Earnings | PE | Absolute PE | PS |
|---|---|---|---|---|---|---|
| Mon, 03 Jun 2024 | UK£184.8b | UK£238.4b | UK£11.5b | 10.8x | 16.1x | 0.8x |
| Wed, 01 May 2024 | UK£184.6b | UK£243.2b | UK£11.7b | 10.1x | 15.8x | 0.8x |
| Fri, 29 Mar 2024 | UK£164.6b | UK£240.8b | UK£11.6b | 10.2x | 14.2x | 0.7x |
| Sun, 25 Feb 2024 | UK£158.1b | UK£239.9b | UK£11.6b | 10.6x | 13.6x | 0.7x |
| Tue, 23 Jan 2024 | UK£162.3b | UK£248.3b | UK£16.1b | 8.8x | 10.1x | 0.7x |
| Thu, 21 Dec 2023 | UK£181.3b | UK£249.3b | UK£16.2b | 11.3x | 11.2x | 0.7x |
| Sat, 18 Nov 2023 | UK£178.9b | UK£253.9b | UK£16.5b | 10.8x | 10.8x | 0.7x |
| Mon, 16 Oct 2023 | UK£170.9b | UK£259.9b | UK£16.9b | 10.3x | 10.1x | 0.7x |
| Wed, 13 Sep 2023 | UK£165.9b | UK£252.9b | UK£16.4b | 6.8x | 10.1x | 0.7x |
| Fri, 11 Aug 2023 | UK£166.3b | UK£247.9b | UK£16.1b | 8.4x | 10.3x | 0.7x |
| Sun, 09 Jul 2023 | UK£166.4b | UK£271.1b | UK£26.7b | 7.6x | 6.2x | 0.6x |
| Tue, 06 Jun 2023 | UK£170.9b | UK£279.6b | UK£27.5b | 6.4x | 6.2x | 0.6x |
| Thu, 04 May 2023 | UK£173.5b | UK£277.3b | UK£27.3b | 8.1x | 6.3x | 0.6x |
| Sat, 01 Apr 2023 | UK£186.3b | UK£282.0b | UK£27.8b | 8.2x | 6.7x | 0.7x |
| Mon, 27 Feb 2023 | UK£194.0b | UK£291.2b | UK£28.7b | 6.3x | 6.8x | 0.7x |
| Wed, 25 Jan 2023 | UK£223.0b | UK£278.8b | UK£32.9b | 6.3x | 6.8x | 0.8x |
| Fri, 23 Dec 2022 | UK£207.8b | UK£285.6b | UK£33.7b | 6.5x | 6.2x | 0.7x |
| Sun, 20 Nov 2022 | UK£197.2b | UK£288.2b | UK£34.0b | 6x | 5.8x | 0.7x |
| Tue, 18 Oct 2022 | UK£175.3b | UK£306.1b | UK£36.1b | 5x | 4.9x | 0.6x |
| Thu, 15 Sep 2022 | UK£181.0b | UK£296.7b | UK£35.1b | 5.7x | 5.2x | 0.6x |
| Sat, 13 Aug 2022 | UK£181.3b | UK£283.1b | UK£33.4b | 6.6x | 5.4x | 0.6x |
| Mon, 11 Jul 2022 | UK£174.1b | UK£257.2b | UK£28.8b | 5.7x | 6x | 0.7x |
| Wed, 08 Jun 2022 | UK£223.2b | UK£246.1b | UK£27.6b | 7x | 8.1x | 0.9x |
| Fri, 06 May 2022 | UK£201.4b | UK£250.9b | UK£28.1b | 7x | 7.2x | 0.8x |
| Sun, 03 Apr 2022 | UK£244.4b | UK£254.0b | UK£33.0b | 7.8x | 7.4x | 1x |
| Tue, 01 Mar 2022 | UK£224.1b | UK£248.5b | UK£32.4b | 8.8x | 6.9x | 0.9x |
| Thu, 27 Jan 2022 | UK£227.7b | UK£215.0b | UK£27.9b | 9.1x | 8.2x | 1.1x |
| Sat, 25 Dec 2021 | UK£214.7b | UK£216.7b | UK£28.1b | 9.5x | 7.6x | 1x |
| Mon, 22 Nov 2021 | UK£206.1b | UK£215.8b | UK£28.0b | 10.5x | 7.4x | 1x |
| Wed, 20 Oct 2021 | UK£221.3b | UK£210.9b | UK£27.5b | 10.2x | 8.1x | 1x |
| Fri, 17 Sep 2021 | UK£213.4b | UK£211.3b | UK£27.5b | 7x | 7.8x | 1x |
| Sun, 15 Aug 2021 | UK£234.1b | UK£210.8b | UK£27.5b | 9x | 8.5x | 1.1x |
| Thu, 10 Jun 2021 | UK£241.1b | UK£192.7b | UK£19.0b | 11.3x | 12.7x | 1.3x |
Price to Earnings Ratio
12.7x
Current Industry PE
- Investors are optimistic on the British Diversified Metals and Mining industry, and appear confident in long term growth rates.
- The industry is trading at a PE ratio of 16.1x which is higher than its 3-year average PE of 8.7x.
- The industry is trading close to its 3-year average PS ratio of 0.82x.
Past Earnings Growth
- The earnings for companies in the Diversified Metals and Mining industry have declined 16% per year over the last three years.
- Meanwhile revenues for these companies have grown 7.4% per year.
- This means that although more sales are being generated, either the cost of doing business or the level of investment back into businesses has increased, which has decreased profits.
Industry Comparison
How does U.K. Diversified Metals and Mining compare with similar industries?
| GB Market | -0.56% | |
| Materials | -2.06% | |
| Metals and Mining | -2.20% | |
| Diversified Metals and Mining | -2.46% | |
| Precious Metals and Minerals | 3.26% | |
| Gold | 2.24% | |
| Aluminum | 0% | |
| Silver | 0% | |
| Copper | -1.76% | |
| Steel | -3.72% | |
Industry PEThere are no additional sub-industries under this industry.
Forecasted GrowthThere are no additional sub-industries under this industry.
Top Stock Gainers and Losers
Which companies have driven the market over the last 7 days?
| Company | Last Price | 7D | 1Y | Valuation | |
|---|---|---|---|---|---|
| KOD Kodal Minerals | UK£0.006 | 22.4% +UK£22.3m | -7.0% | PB8.3x | |
| KP2 Kore Potash | UK£0.017 | 38.8% +UK£20.2m | 134.5% | PB0.5x | |
| GMET Golden Metal Resources | UK£0.22 | 35.0% +UK£6.0m | 208.6% | PS29393.8x | |
| SAV Savannah Resources | UK£0.035 | 7.8% +UK£4.6m | -25.8% | PB2.3x | |
| RBW Rainbow Rare Earths | UK£0.11 | 4.5% +UK£3.0m | 30.9% | PB4.9x |