Advertisement
- United States
- /
- Oil and Gas
- /
- NYSE:XOM
Discover 3 Top Dividend Stocks For Your Portfolio

Simply Wall St
Reviewed by Simply Wall St
In the wake of the recent U.S. government shutdown resolution, major stock indices like the Dow Jones and Nasdaq have experienced fluctuations, with technology shares leading declines. Amidst these market shifts, dividend stocks continue to attract investors seeking steady income streams and potential stability in uncertain economic conditions.
Top 10 Dividend Stocks In The United States
| Name | Dividend Yield | Dividend Rating |
| Rayonier (RYN) | 13.05% | ★★★★★☆ |
| Provident Financial Services (PFS) | 5.11% | ★★★★★★ |
| Peoples Bancorp (PEBO) | 5.55% | ★★★★★★ |
| Interpublic Group of Companies (IPG) | 5.19% | ★★★★★★ |
| Heritage Commerce (HTBK) | 4.86% | ★★★★★★ |
| First Interstate BancSystem (FIBK) | 5.79% | ★★★★★★ |
| Farmers National Banc (FMNB) | 5.09% | ★★★★★★ |
| Ennis (EBF) | 5.92% | ★★★★★★ |
| Columbia Banking System (COLB) | 5.31% | ★★★★★★ |
| Citizens & Northern (CZNC) | 5.77% | ★★★★★★ |
Click here to see the full list of 127 stocks from our Top US Dividend Stocks screener.
Underneath we present a selection of stocks filtered out by our screen.
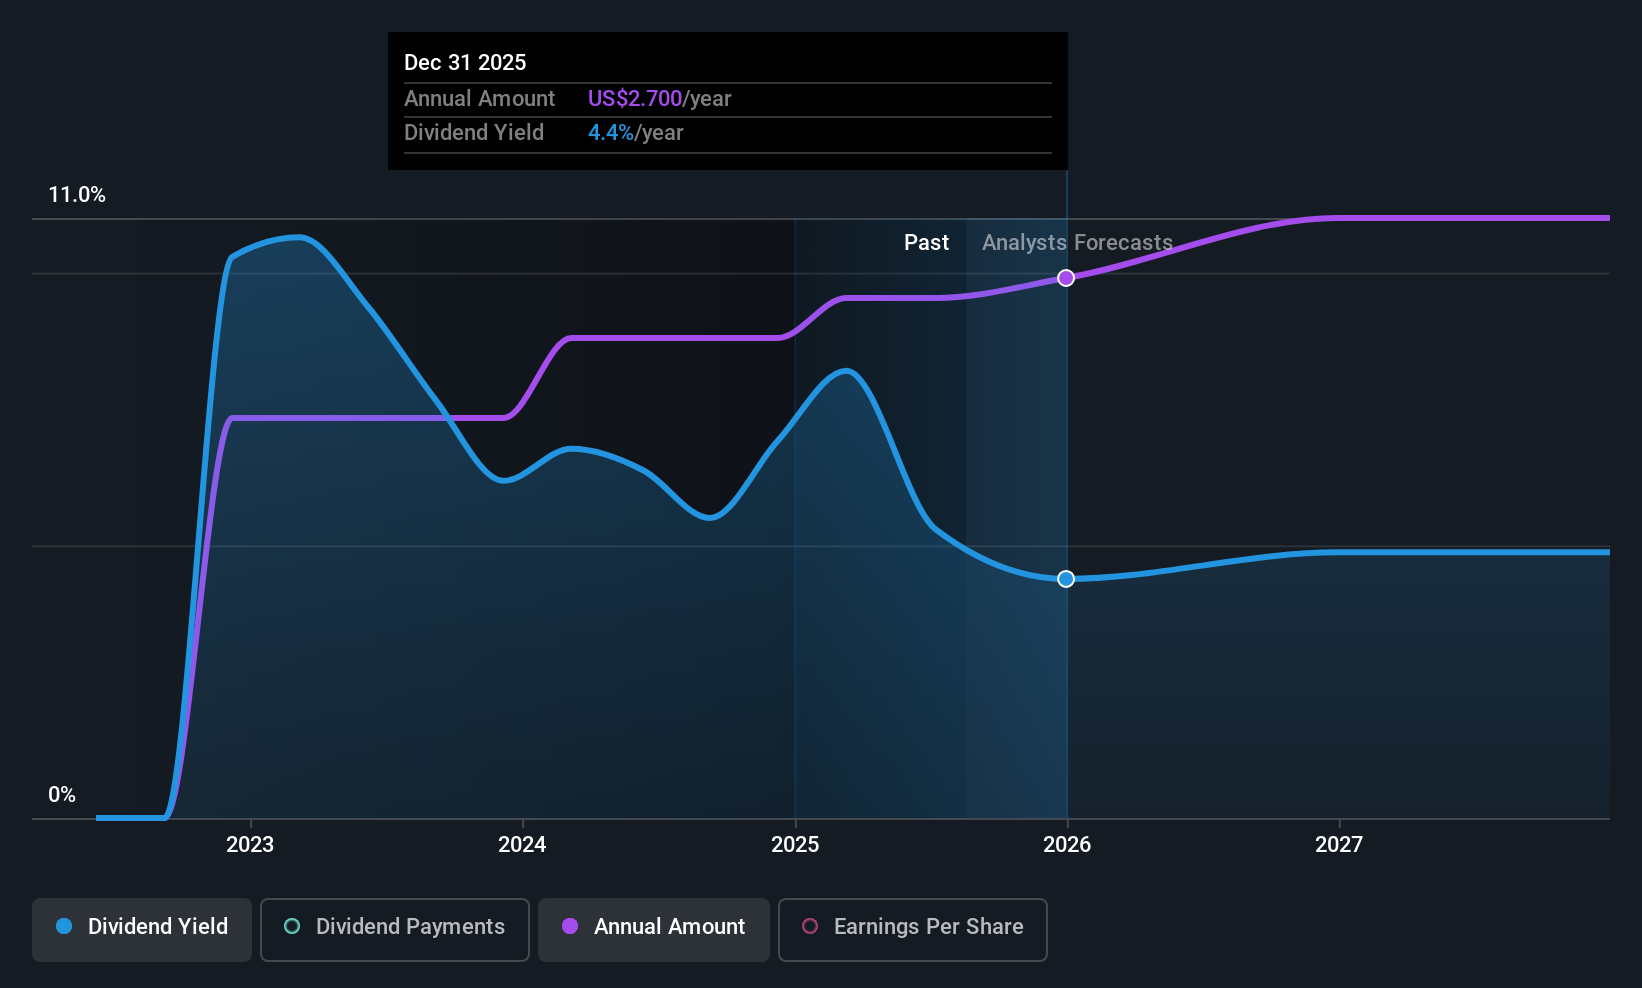
Euroseas (ESEA)
Simply Wall St Dividend Rating: ★★★★☆☆
Overview: Euroseas Ltd. offers ocean-going transportation services globally and has a market cap of approximately $417.38 million.
Operations: Euroseas Ltd. generates its revenue primarily from its transportation - shipping segment, which amounts to $221.03 million.
Dividend Yield: 4.6%
Euroseas Ltd. offers a compelling dividend profile with a payout ratio of 11.4%, ensuring dividends are well-covered by earnings, while the cash payout ratio at 74.5% confirms coverage by cash flows. The recent quarterly dividend of US$0.70 per share reflects its top-tier yield in the U.S. market, although it has only been paying dividends for three years with consistent growth and stability. Recent charter agreements bolster revenue visibility into 2026, enhancing dividend sustainability prospects despite modest earnings growth challenges ahead.
- Get an in-depth perspective on Euroseas' performance by reading our dividend report here.
- In light of our recent valuation report, it seems possible that Euroseas is trading behind its estimated value.
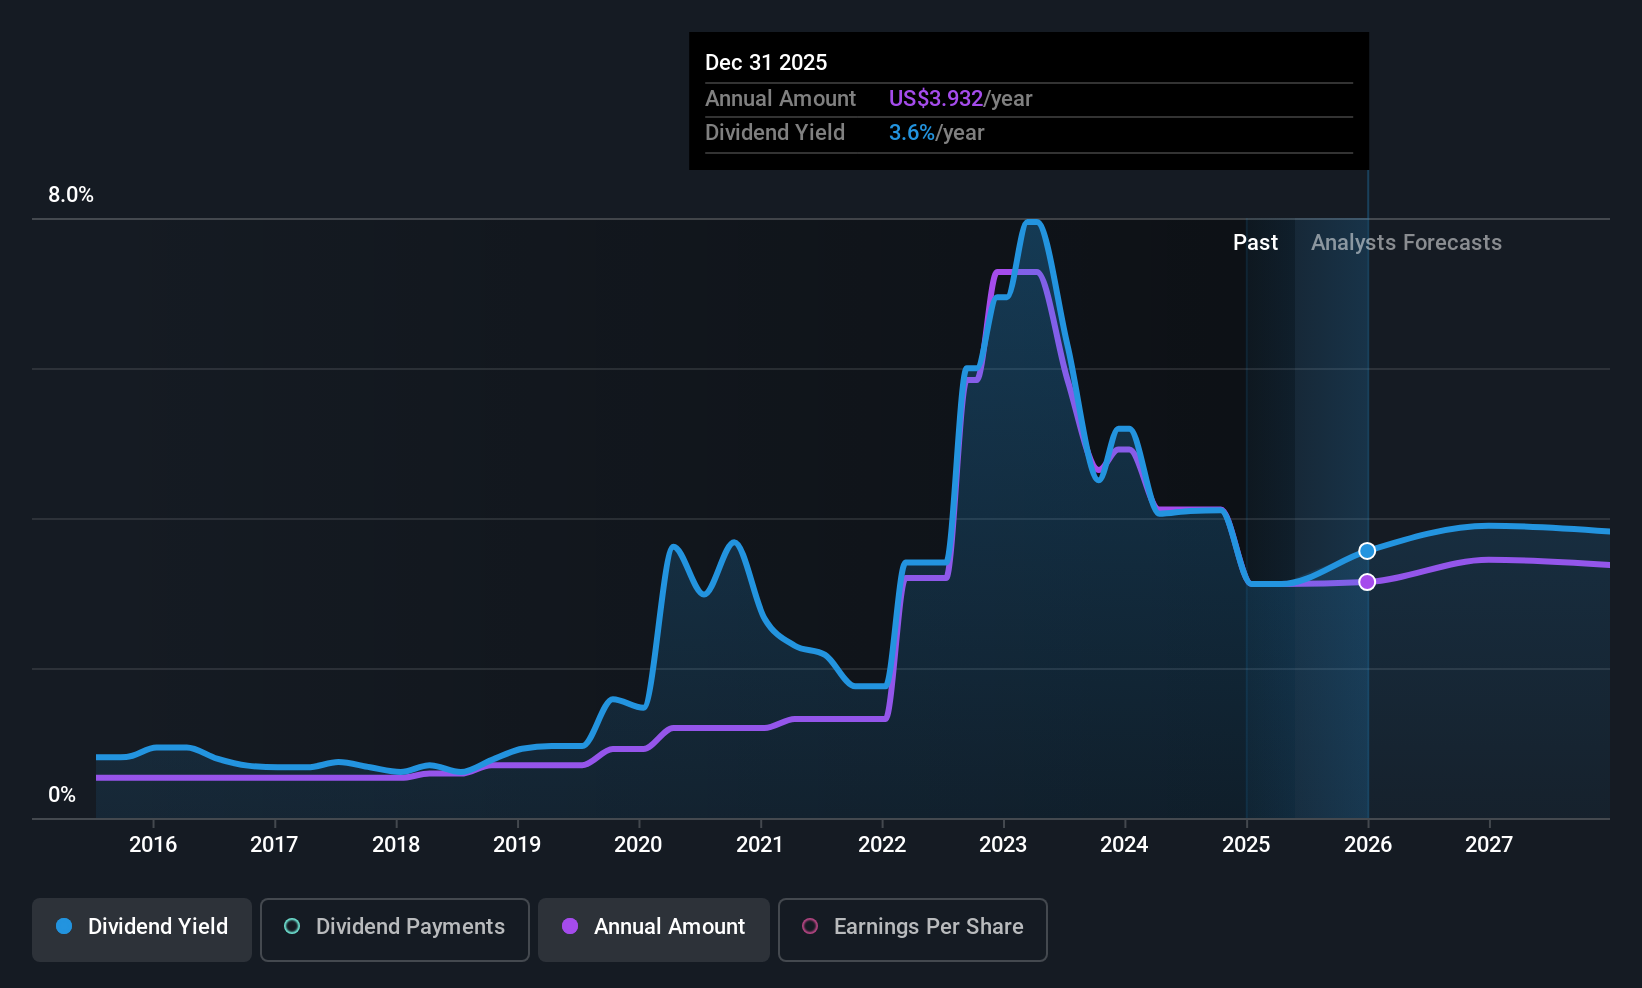
EOG Resources (EOG)
Simply Wall St Dividend Rating: ★★★★☆☆
Overview: EOG Resources, Inc. is an energy company engaged in the exploration, development, production, and marketing of crude oil, natural gas liquids, and natural gas across the United States and internationally with a market cap of approximately $59.33 billion.
Operations: EOG Resources generates revenue primarily from its crude oil and natural gas exploration and production segment, which accounted for $22.65 billion.
Dividend Yield: 3.8%
EOG Resources declared a quarterly dividend of US$1.02 per share, translating to an annual rate of US$4.08, with no history of suspension or reduction. The payout ratio is 39.1%, indicating dividends are well-covered by earnings and cash flows (56.9%). Despite trading below estimated fair value and peers, its dividend yield is lower than top-tier U.S. payers at 3.75%. Dividend growth has been inconsistent over the past decade despite recent increases in payments.
- Navigate through the intricacies of EOG Resources with our comprehensive dividend report here.
- Insights from our recent valuation report point to the potential undervaluation of EOG Resources shares in the market.
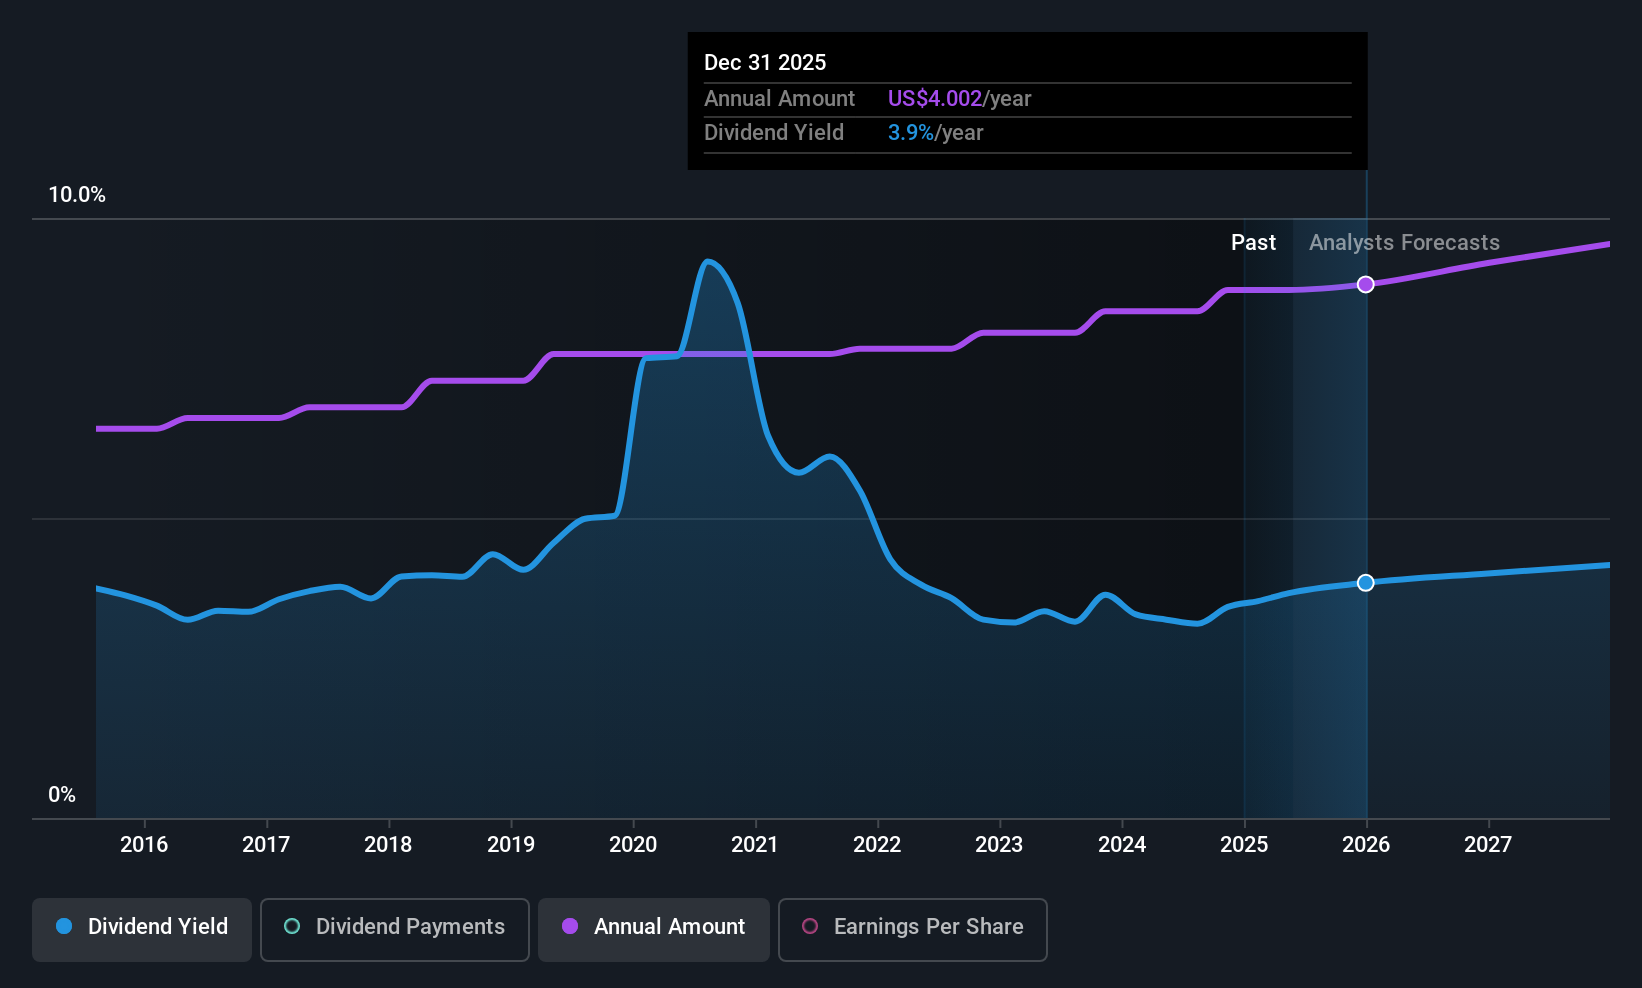
Exxon Mobil (XOM)
Simply Wall St Dividend Rating: ★★★★★☆
Overview: Exxon Mobil Corporation is involved in the exploration and production of crude oil and natural gas across several countries, including the United States, Guyana, and Canada, with a market cap of $505.13 billion.
Operations: Exxon Mobil's revenue segments include Upstream operations in the United States at $53.16 billion and internationally at $52.57 billion, Energy Products in the United States at $118.27 billion and internationally at $170.89 billion, Chemical Products in the United States at $14.55 billion and internationally at $17.48 billion, as well as Specialty Products in the United States totaling $7.82 billion and outside the U.S. amounting to $12.68 billion.
Dividend Yield: 3.5%
Exxon Mobil offers a stable dividend, recently increased to US$1.03 per share, with a history of reliability over the past decade. Its payout ratios of 57.5% for earnings and 73.1% for cash flows suggest sustainability, though its 3.49% yield is below top-tier U.S. payers. Recent developments include a US$111 million fixed-income offering and share buybacks totaling US$66 billion since December 2021, reflecting strategic capital management amidst ongoing restructuring efforts and asset sales considerations in New Zealand.
- Take a closer look at Exxon Mobil's potential here in our dividend report.
- Our comprehensive valuation report raises the possibility that Exxon Mobil is priced lower than what may be justified by its financials.
Key Takeaways
- Dive into all 127 of the Top US Dividend Stocks we have identified here.
- Already own these companies? Link your portfolio to Simply Wall St and get alerts on any new warning signs to your stocks.
- Join a community of smart investors by using Simply Wall St. It's free and delivers expert-level analysis on worldwide markets.
Curious About Other Options?
- Explore high-performing small cap companies that haven't yet garnered significant analyst attention.
- Fuel your portfolio with companies showing strong growth potential, backed by optimistic outlooks both from analysts and management.
- Find companies with promising cash flow potential yet trading below their fair value.
This article by Simply Wall St is general in nature. We provide commentary based on historical data and analyst forecasts only using an unbiased methodology and our articles are not intended to be financial advice. It does not constitute a recommendation to buy or sell any stock, and does not take account of your objectives, or your financial situation. We aim to bring you long-term focused analysis driven by fundamental data. Note that our analysis may not factor in the latest price-sensitive company announcements or qualitative material. Simply Wall St has no position in any stocks mentioned.
Valuation is complex, but we're here to simplify it.
Discover if Exxon Mobil might be undervalued or overvalued with our detailed analysis, featuring fair value estimates, potential risks, dividends, insider trades, and its financial condition.
Access Free AnalysisHave feedback on this article? Concerned about the content? Get in touch with us directly. Alternatively, email editorial-team@simplywallst.com
About NYSE:XOM
Exxon Mobil
Engages in the exploration and production of crude oil and natural gas in the United States, Guyana, Canada, the United Kingdom, Singapore, France, and internationally.
Excellent balance sheet established dividend payer.
Similar Companies
Market Insights

Advertisement
Community Narratives
MINISO's fair value is projected at 26.69 with an anticipated PE ratio shift of 20x
Fair Value US$24.03|9.0% undervalued
BE
Community Contributor
Procter & Gamble: A Dividend Giant Facing Slowing Growth
Fair Value US$119.81|23.5% overvalued
AN
Community Contributor
Eli Lilly's Future Growth Driven by Tirzepatide and Favorable Market Conditions
Fair Value US$1.19k|14.4% undervalued
EA
Community Contributor