- United States
- /
- Transportation
- /
- NasdaqGS:CAR
Investors in Avis Budget Group (NASDAQ:CAR) have seen strong returns of 250% over the past five years


It hasn't been the best quarter for Avis Budget Group, Inc. (NASDAQ:CAR) shareholders, since the share price has fallen 14% in that time. But that doesn't change the fact that the returns over the last five years have been very strong. Indeed, the share price is up an impressive 233% in that time. To some, the recent pullback wouldn't be surprising after such a fast rise. Ultimately business performance will determine whether the stock price continues the positive long term trend. While the long term returns are impressive, we do have some sympathy for those who bought more recently, given the 51% drop, in the last year.
So let's assess the underlying fundamentals over the last 5 years and see if they've moved in lock-step with shareholder returns.
View our latest analysis for Avis Budget Group
To quote Buffett, 'Ships will sail around the world but the Flat Earth Society will flourish. There will continue to be wide discrepancies between price and value in the marketplace...' One imperfect but simple way to consider how the market perception of a company has shifted is to compare the change in the earnings per share (EPS) with the share price movement.
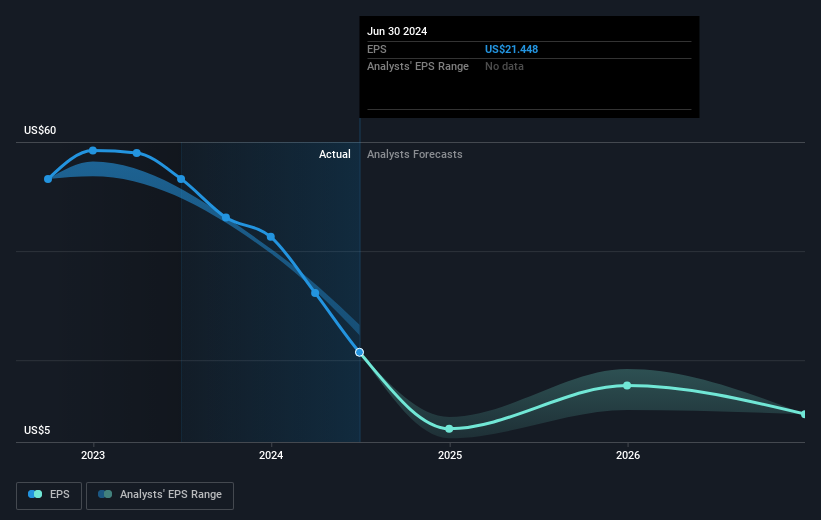
Over half a decade, Avis Budget Group managed to grow its earnings per share at 54% a year. The EPS growth is more impressive than the yearly share price gain of 27% over the same period. So one could conclude that the broader market has become more cautious towards the stock. This cautious sentiment is reflected in its (fairly low) P/E ratio of 3.98.
You can see below how EPS has changed over time (discover the exact values by clicking on the image).
We know that Avis Budget Group has improved its bottom line over the last three years, but what does the future have in store? This free interactive report on Avis Budget Group's balance sheet strength is a great place to start, if you want to investigate the stock further.
What About The Total Shareholder Return (TSR)?
Investors should note that there's a difference between Avis Budget Group's total shareholder return (TSR) and its share price change, which we've covered above. The TSR attempts to capture the value of dividends (as if they were reinvested) as well as any spin-offs or discounted capital raisings offered to shareholders. We note that Avis Budget Group's TSR, at 250% is higher than its share price return of 233%. When you consider it hasn't been paying a dividend, this data suggests shareholders have benefitted from a spin-off, or had the opportunity to acquire attractively priced shares in a discounted capital raising.
A Different Perspective
While the broader market gained around 34% in the last year, Avis Budget Group shareholders lost 49%. However, keep in mind that even the best stocks will sometimes underperform the market over a twelve month period. Longer term investors wouldn't be so upset, since they would have made 28%, each year, over five years. It could be that the recent sell-off is an opportunity, so it may be worth checking the fundamental data for signs of a long term growth trend. While it is well worth considering the different impacts that market conditions can have on the share price, there are other factors that are even more important. Take risks, for example - Avis Budget Group has 3 warning signs (and 2 which are significant) we think you should know about.
For those who like to find winning investments this free list of undervalued companies with recent insider purchasing, could be just the ticket.
Please note, the market returns quoted in this article reflect the market weighted average returns of stocks that currently trade on American exchanges.
New: Manage All Your Stock Portfolios in One Place
We've created the ultimate portfolio companion for stock investors, and it's free.
• Connect an unlimited number of Portfolios and see your total in one currency
• Be alerted to new Warning Signs or Risks via email or mobile
• Track the Fair Value of your stocks
Have feedback on this article? Concerned about the content? Get in touch with us directly. Alternatively, email editorial-team (at) simplywallst.com.
This article by Simply Wall St is general in nature. We provide commentary based on historical data and analyst forecasts only using an unbiased methodology and our articles are not intended to be financial advice. It does not constitute a recommendation to buy or sell any stock, and does not take account of your objectives, or your financial situation. We aim to bring you long-term focused analysis driven by fundamental data. Note that our analysis may not factor in the latest price-sensitive company announcements or qualitative material. Simply Wall St has no position in any stocks mentioned.
About NasdaqGS:CAR
Avis Budget Group
Provides car and truck rentals, car sharing, and ancillary products and services to businesses and consumers in the Americas, Europe, the Middle East and Africa, Asia, and Australasia.
Undervalued low.

