
Advertisement
- United States
- /
- Electronic Equipment and Components
- /
- NasdaqGS:PLXS
Is Plexus Corp.'s (NASDAQ:PLXS) Latest Stock Performance A Reflection Of Its Financial Health?

Plexus' (NASDAQ:PLXS) stock is up by a considerable 23% over the past three months. Given that the market rewards strong financials in the long-term, we wonder if that is the case in this instance. Specifically, we decided to study Plexus' ROE in this article.
Return on Equity or ROE is a test of how effectively a company is growing its value and managing investors’ money. In other words, it is a profitability ratio which measures the rate of return on the capital provided by the company's shareholders.
See our latest analysis for Plexus
How Is ROE Calculated?
Return on equity can be calculated by using the formula:
Return on Equity = Net Profit (from continuing operations) ÷ Shareholders' Equity
So, based on the above formula, the ROE for Plexus is:
12% = US$117m ÷ US$945m (Based on the trailing twelve months to July 2020).
The 'return' is the profit over the last twelve months. That means that for every $1 worth of shareholders' equity, the company generated $0.12 in profit.
What Has ROE Got To Do With Earnings Growth?
So far, we've learned that ROE is a measure of a company's profitability. We now need to evaluate how much profit the company reinvests or "retains" for future growth which then gives us an idea about the growth potential of the company. Assuming everything else remains unchanged, the higher the ROE and profit retention, the higher the growth rate of a company compared to companies that don't necessarily bear these characteristics.
Plexus' Earnings Growth And 12% ROE
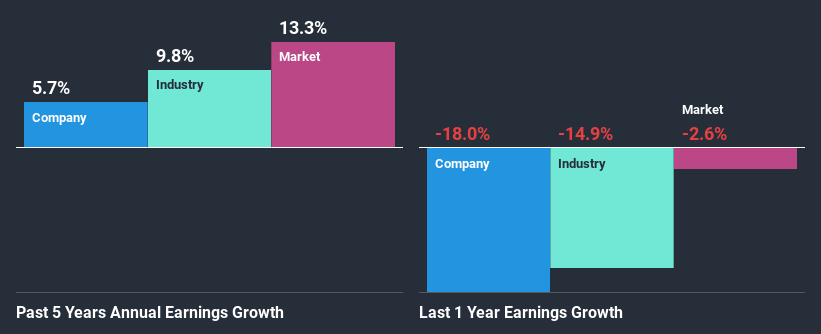
To begin with, Plexus seems to have a respectable ROE. On comparing with the average industry ROE of 9.0% the company's ROE looks pretty remarkable. This certainly adds some context to Plexus' decent 5.7% net income growth seen over the past five years.
We then compared Plexus' net income growth with the industry and found that the company's growth figure is lower than the average industry growth rate of 9.8% in the same period, which is a bit concerning.
The basis for attaching value to a company is, to a great extent, tied to its earnings growth. What investors need to determine next is if the expected earnings growth, or the lack of it, is already built into the share price. Doing so will help them establish if the stock's future looks promising or ominous. One good indicator of expected earnings growth is the P/E ratio which determines the price the market is willing to pay for a stock based on its earnings prospects. So, you may want to check if Plexus is trading on a high P/E or a low P/E, relative to its industry.
Is Plexus Making Efficient Use Of Its Profits?
Plexus doesn't pay any dividend, meaning that all of its profits are being reinvested in the business, which explains the fair bit of earnings growth the company has seen.
Summary
In total, we are pretty happy with Plexus' performance. Particularly, we like that the company is reinvesting heavily into its business, and at a high rate of return. As a result, the decent growth in its earnings is not surprising. With that said, the latest industry analyst forecasts reveal that the company's earnings are expected to accelerate. Are these analysts expectations based on the broad expectations for the industry, or on the company's fundamentals? Click here to be taken to our analyst's forecasts page for the company.
If you’re looking to trade Plexus, open an account with the lowest-cost* platform trusted by professionals, Interactive Brokers. Their clients from over 200 countries and territories trade stocks, options, futures, forex, bonds and funds worldwide from a single integrated account. Promoted
New: Manage All Your Stock Portfolios in One Place
We've created the ultimate portfolio companion for stock investors, and it's free.
• Connect an unlimited number of Portfolios and see your total in one currency
• Be alerted to new Warning Signs or Risks via email or mobile
• Track the Fair Value of your stocks
This article by Simply Wall St is general in nature. It does not constitute a recommendation to buy or sell any stock, and does not take account of your objectives, or your financial situation. We aim to bring you long-term focused analysis driven by fundamental data. Note that our analysis may not factor in the latest price-sensitive company announcements or qualitative material. Simply Wall St has no position in any stocks mentioned.
*Interactive Brokers Rated Lowest Cost Broker by StockBrokers.com Annual Online Review 2020
Have feedback on this article? Concerned about the content? Get in touch with us directly. Alternatively, email editorial-team@simplywallst.com.
About NasdaqGS:PLXS
Plexus
Provides electronic manufacturing services in the United States and internationally.
Flawless balance sheet with solid track record.
Similar Companies
Market Insights

Advertisement
Community Narratives
MicroStrategy: Volatile Gamble or Golden Opportunity?
Fair Value US$663.00|36.2% undervalued
BL
Community Contributor
Emerging Markets and Debt Reduction Will Propel Bath & Body Works Forward
Fair Value US$40.73|22.0% undervalued
ZW
Community Contributor
An amazing opportunity to potentially get a 100 bagger
Fair Value US$10.00|46.4% overvalued
DA
Community Contributor