Advertisement
- United States
- /
- IT
- /
- NasdaqGS:SHOP
Shopify’s Valuation Questioned After 11.9% Drop and Expanded TikTok Partnership

Simply Wall St
Reviewed by Bailey Pemberton
- Wondering if Shopify is priced right for its next big move? You are not alone. Plenty of investors are digging into what really drives the value of this stock.
- Shopify's price journey has been lively recently, with a 69.4% gain in the last year. However, a noticeable dip of 11.9% in the past week shows there is no shortage of twists along the way.
- The recent volatility comes after Shopify expanded its partnership with TikTok, opening up new possible revenue streams and capturing attention across the e-commerce landscape. At the same time, broader tech market swings have amplified reactions in high-growth names like Shopify.
- According to our valuation framework, Shopify scores 0 out of 6 on key undervaluation checks, so it is not scoring any wins on traditional value metrics so far. Before drawing conclusions, let us dig into how analysts and different valuation methods view Shopify and save the best alternative for the end of the article.
Shopify scores just 0/6 on our valuation checks. See what other red flags we found in the full valuation breakdown.
Approach 1: Shopify Discounted Cash Flow (DCF) Analysis
The Discounted Cash Flow (DCF) model estimates a company's value by projecting its future cash flows and discounting them back to today's dollars. For Shopify, this model uses the latest Free Cash Flow figure of $1.89 billion as a starting point and extrapolates into the future, combining both short-term analyst forecasts and longer-term projections beyond five years.
According to this DCF analysis, Shopify's Free Cash Flow is projected to grow significantly, reaching around $5.37 billion by the end of 2029. Although analyst estimates help inform the first five years, Simply Wall St extends these projections further. The analysis shows continued growth out to 2035, when Free Cash Flow could surpass $9.5 billion. All figures are presented in US dollars.
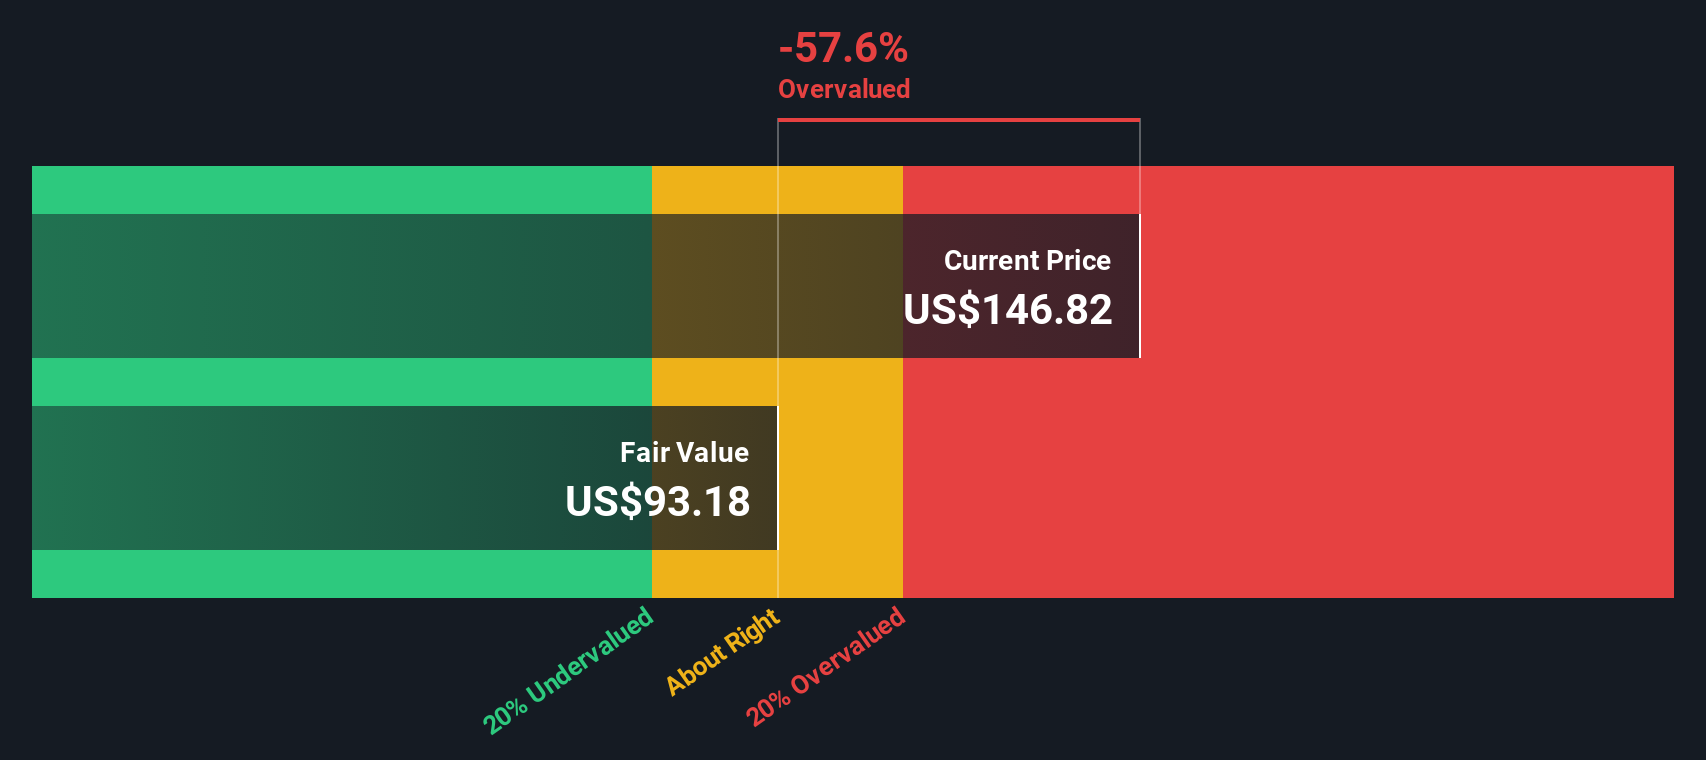
Based on these projections, the DCF model calculates Shopify’s intrinsic value at $95.25 per share. With the current share price implying a 60% premium to this fair value, the market appears to have already priced in a lot of future growth. This approach indicates Shopify may be overvalued.
Result: OVERVALUED
Our Discounted Cash Flow (DCF) analysis suggests Shopify may be overvalued by 60.0%. Discover 884 undervalued stocks or create your own screener to find better value opportunities.
Approach 2: Shopify Price vs Earnings (PE Ratio Analysis)
The Price-to-Earnings (PE) ratio is widely used for valuing profitable companies like Shopify because it relates a company's stock price to its earnings, making it a straightforward indicator of how much investors are willing to pay for each dollar of current profit. For companies that are consistently generating strong earnings, the PE ratio can help assess whether a stock is priced attractively compared to its profitability.
Growth expectations and risk are two important factors that shape what a "normal" or "fair" PE ratio should be. Higher growth prospects can justify a higher PE as investors anticipate larger earnings in the future. Conversely, higher risks typically warrant a lower multiple, as uncertainty about future profits leads to more cautious pricing.
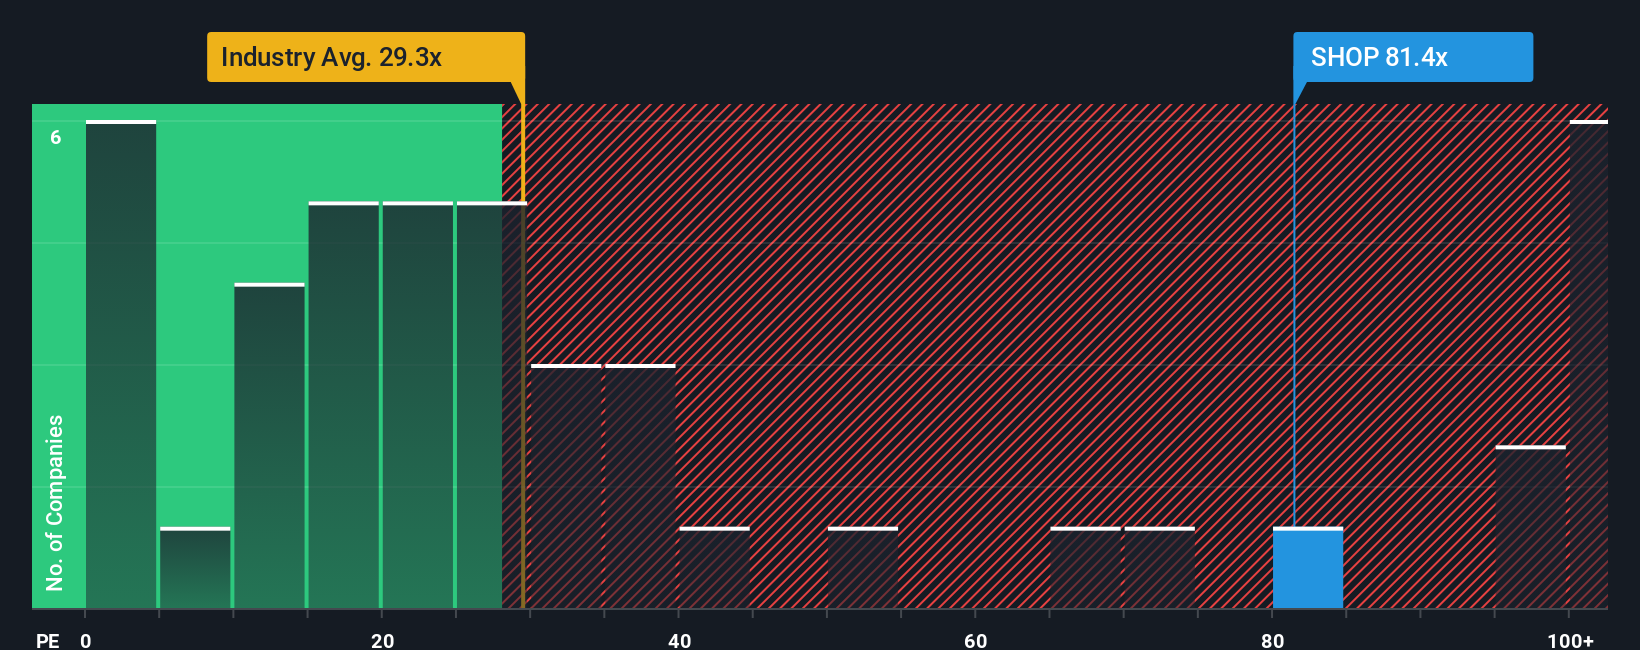
Shopify currently trades at a PE ratio of 111.4x, which is significantly above the industry average of 31.1x and the average for its peers at 40.6x. Simply Wall St's proprietary "Fair Ratio" for Shopify is 52.1x. This Fair Ratio is more comprehensive than a simple peer or industry comparison because it reflects factors such as Shopify’s expected earnings growth, margins, industry classification, size, and risk profile.
Looking at these numbers, Shopify is trading well above its Fair Ratio. This suggests the market has priced in exceptional future prospects, possibly more than fundamentals justify at this stage.
Result: OVERVALUED
PE ratios tell one story, but what if the real opportunity lies elsewhere? Discover 1404 companies where insiders are betting big on explosive growth.
Upgrade Your Decision Making: Choose your Shopify Narrative
Earlier we mentioned that there's an even better way to understand valuation, so let's introduce you to Narratives. A Narrative is more than just a number; it is your story for a company, connecting your expectations for Shopify's future revenue, earnings, and margins to your own estimate of fair value.
Narratives work by blending the company's evolving business story with a financial forecast, allowing you to map where you think Shopify's growth, risks, and margins are heading. This approach turns complex forecasts into concrete fair value calculations, making it easier for anyone to compare their view with the current market price.
Millions of investors use Narratives every day on Simply Wall St's Community page, where you can see how others view Shopify, create your own Narrative in minutes, and react quickly when new information such as financial results or major news appears. Narratives are always updated dynamically, so your view and its fair value stay current with the latest developments.
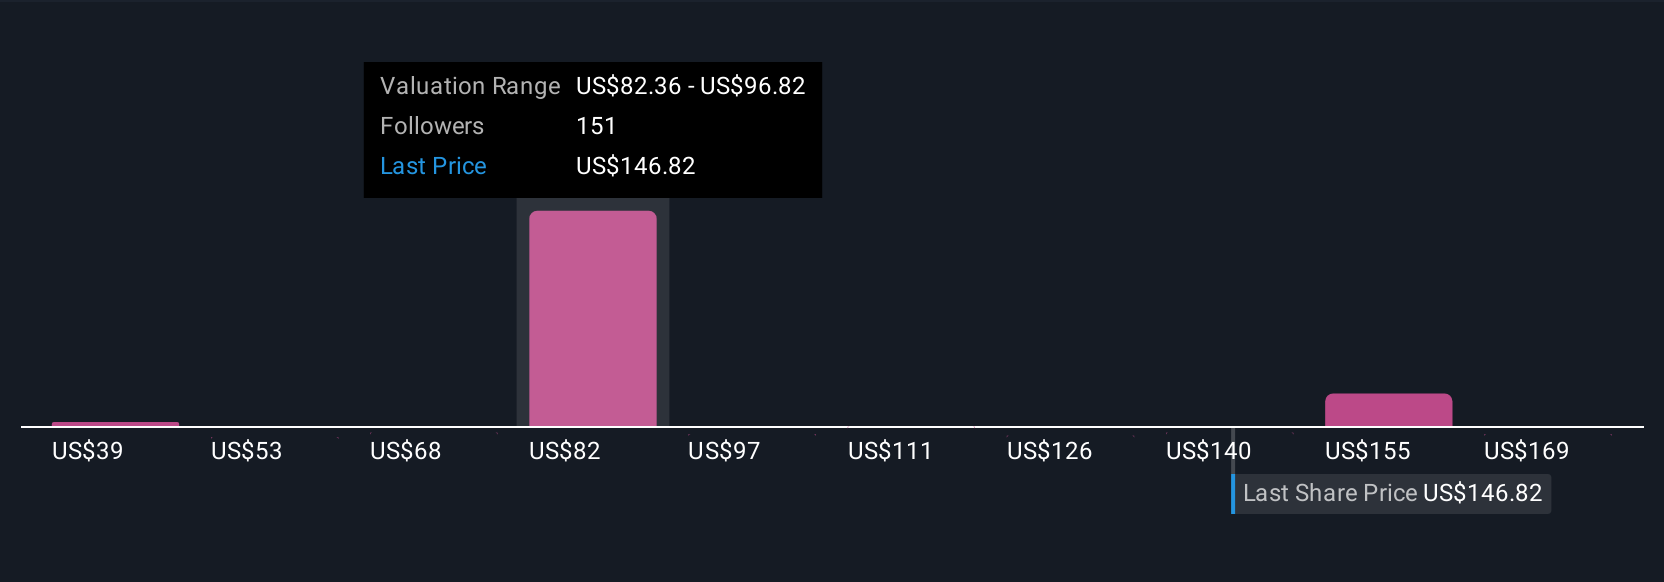
For example, some investors may craft a bullish Narrative around international expansion and AI-driven ecosystem growth, estimating a fair value as high as $200. Others, focusing on competition and margin pressure, might set theirs closer to $114. Narratives help you make smarter buy or sell decisions by turning your perspective into a clear, actionable fair value, so you can see if Shopify is priced right for your view of the future.
Do you think there's more to the story for Shopify? Head over to our Community to see what others are saying!
This article by Simply Wall St is general in nature. We provide commentary based on historical data and analyst forecasts only using an unbiased methodology and our articles are not intended to be financial advice. It does not constitute a recommendation to buy or sell any stock, and does not take account of your objectives, or your financial situation. We aim to bring you long-term focused analysis driven by fundamental data. Note that our analysis may not factor in the latest price-sensitive company announcements or qualitative material. Simply Wall St has no position in any stocks mentioned.
New: Manage All Your Stock Portfolios in One Place
We've created the ultimate portfolio companion for stock investors, and it's free.
• Connect an unlimited number of Portfolios and see your total in one currency
• Be alerted to new Warning Signs or Risks via email or mobile
• Track the Fair Value of your stocks
Have feedback on this article? Concerned about the content? Get in touch with us directly. Alternatively, email editorial-team@simplywallst.com
About NasdaqGS:SHOP
Shopify
A commerce technology company, provides tools to start, scale, market, and run a business of various sizes in Canada, the United States, Europe, the Middle East, Africa, the Asia Pacific, and Latin America.
Flawless balance sheet with reasonable growth potential.
Similar Companies
Market Insights

Advertisement
Community Narratives
The "Molecular Pencil": Why Beam's Technology is Built to Win
Fair Value US$65.01|65.4% undervalued
DA
Community Contributor
The silent giant behind virtually every advanced chip powering AI, smartphones, and modern infrastructure.
Fair Value US$310.00|6.1% undervalued
OS
Community Contributor
ADP Stock: Solid Fundamentals, But AI Investments Test Its Margin Resilience
Fair Value US$387.77|34.2% undervalued
YI
Community Contributor
MINISO's fair value is projected at 26.69 with an anticipated PE ratio shift of 20x
Fair Value US$24.03|9.6% undervalued
BE
Community Contributor