Advertisement
- United States
- /
- Semiconductors
- /
- NasdaqGS:TXN
Texas Instruments (TXN): Evaluating Valuation After Revenue Growth and Operational Strengths in Q3

Simply Wall St
Reviewed by Simply Wall St
Texas Instruments (TXN) reported both sequential and year-over-year revenue growth in the third quarter, even as industrial and automotive demand recovered more slowly than anticipated. The company’s operational strengths stood out in recent commentary.
See our latest analysis for Texas Instruments.
Despite posting sequential and year-over-year revenue growth, Texas Instruments’ share price has had a tough ride, dropping 6.5% over the past month and 14% year-to-date. The total shareholder return over the past year paints a more challenging picture, down almost 25%, as investors weigh short-term demand headwinds against the company’s operational strengths and long-term positioning. Momentum has faded lately, but confidence in its competitive advantages remains steady among long-term holders.
If you’re curious about what’s moving beyond Texas Instruments, it’s a smart time to discover See the full list for free..
With operational strengths on display but a lagging share price, the question for investors is clear: Is Texas Instruments now undervalued, or has the market already priced in its future growth prospects?
Most Popular Narrative: 15.6% Undervalued
At $160.55 per share, Texas Instruments trades meaningfully below the narrative’s calculated fair value of $190.31. This difference captures attention as a potential value opportunity in the chip space.
Strategic investment in U.S.-based 300mm wafer fabs and a diversified global manufacturing footprint uniquely position TI to benefit from evolving supply chain localization and customer preferences for geopolitically resilient suppliers. This advantage is likely to help win incremental business, strengthen preferred supplier status, and improve long-term gross margins and pricing power.
Want to know what kind of financial discipline justifies this bullish price target? There is a bold assumption inside the narrative, one ambitious enough to turn heads. The underlying bets are bigger than they appear. Dive in and find out what could tip the balance.
Result: Fair Value of $190.31 (UNDERVALUED)
Have a read of the narrative in full and understand what's behind the forecasts.
However, intensifying competition in analog chips and lingering macroeconomic uncertainty could still derail Texas Instruments' expected recovery and challenge its premium valuation.
Find out about the key risks to this Texas Instruments narrative.
Another View: Looking Through a Different Lens
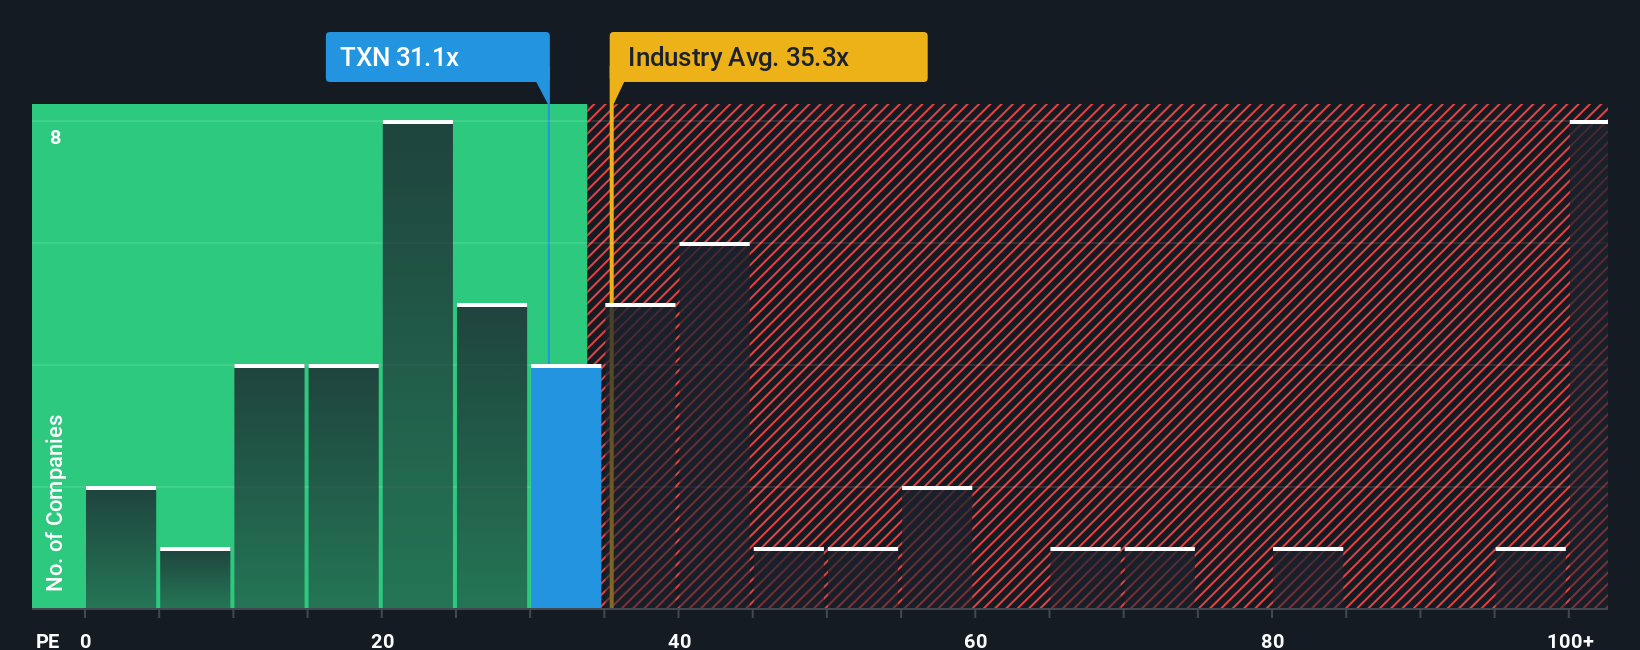
Instead of focusing solely on price targets, investors can compare Texas Instruments’ price-to-earnings ratio of 29.1x with the US semiconductor peer average of 79.1x and an industry average of 35.4x. The fair ratio, at 34.3x, suggests some upside if sentiment shifts. But does a discount like this mean opportunity or hidden risk?
See what the numbers say about this price — find out in our valuation breakdown.
Simply Wall St performs a discounted cash flow (DCF) on every stock in the world every day (check out Texas Instruments for example). We show the entire calculation in full. You can track the result in your watchlist or portfolio and be alerted when this changes, or use our stock screener to discover 876 undervalued stocks based on their cash flows. If you save a screener we even alert you when new companies match - so you never miss a potential opportunity.
Build Your Own Texas Instruments Narrative
If you see the numbers differently or want to shape your own take, it’s quick and simple to build your own perspective. Do it your way.
A great starting point for your Texas Instruments research is our analysis highlighting 3 key rewards and 2 important warning signs that could impact your investment decision.
Looking for More Investment Ideas?
Skip the worry of picking just one stock. Smart investors are using these powerful tools to spot the best opportunities others are missing. Don’t let the next breakout pass you by. Jump in and see what’s possible.
- Accelerate your search for strong income plays by checking out these 16 dividend stocks with yields > 3% offering attractive yields above 3%.
- Pinpoint trailblazing tech leaders by tapping into these 25 AI penny stocks with game-changing potential in artificial intelligence.
- Spot overlooked bargains instantly by reviewing these 876 undervalued stocks based on cash flows guided by serious cash flow metrics.
This article by Simply Wall St is general in nature. We provide commentary based on historical data and analyst forecasts only using an unbiased methodology and our articles are not intended to be financial advice. It does not constitute a recommendation to buy or sell any stock, and does not take account of your objectives, or your financial situation. We aim to bring you long-term focused analysis driven by fundamental data. Note that our analysis may not factor in the latest price-sensitive company announcements or qualitative material. Simply Wall St has no position in any stocks mentioned.
Valuation is complex, but we're here to simplify it.
Discover if Texas Instruments might be undervalued or overvalued with our detailed analysis, featuring fair value estimates, potential risks, dividends, insider trades, and its financial condition.
Access Free AnalysisHave feedback on this article? Concerned about the content? Get in touch with us directly. Alternatively, email editorial-team@simplywallst.com
About NasdaqGS:TXN
Texas Instruments
Designs, manufactures, and sells semiconductors to electronics designers and manufacturers in the United States, China, rest of Asia, Europe, Middle East, Africa, Japan, and internationally.
Proven track record and fair value.
Similar Companies
Market Insights

Advertisement
Community Narratives
The "Molecular Pencil": Why Beam's Technology is Built to Win
Fair Value US$65.01|65.4% undervalued
DA
Community Contributor
The silent giant behind virtually every advanced chip powering AI, smartphones, and modern infrastructure.
Fair Value US$310.00|6.1% undervalued
OS
Community Contributor
ADP Stock: Solid Fundamentals, But AI Investments Test Its Margin Resilience
Fair Value US$387.77|34.2% undervalued
YI
Community Contributor
MINISO's fair value is projected at 26.69 with an anticipated PE ratio shift of 20x
Fair Value US$24.03|9.6% undervalued
BE
Community Contributor