- United States
- /
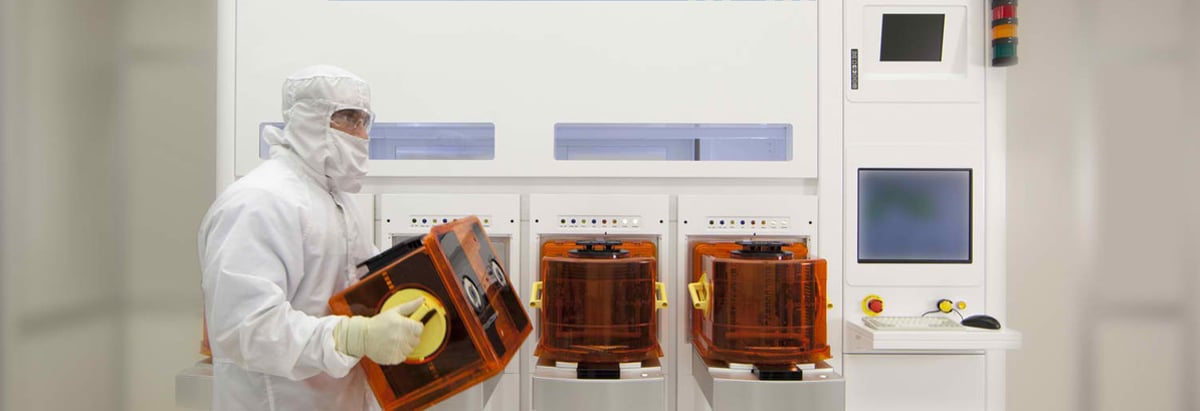
- Semiconductors
- /
- NasdaqGS:AMAT
Applied Materials' (NASDAQ:AMAT) five-year earnings growth trails the fantastic shareholder returns

It hasn't been the best quarter for Applied Materials, Inc. (NASDAQ:AMAT) shareholders, since the share price has fallen 11% in that time. But that doesn't change the fact that the returns over the last half decade have been spectacular. Indeed, the share price is up a whopping 322% in that time. So we don't think the recent decline in the share price means its story is a sad one. Only time will tell if there is still too much optimism currently reflected in the share price.
Since it's been a strong week for Applied Materials shareholders, let's have a look at trend of the longer term fundamentals.
View our latest analysis for Applied Materials
To paraphrase Benjamin Graham: Over the short term the market is a voting machine, but over the long term it's a weighing machine. One imperfect but simple way to consider how the market perception of a company has shifted is to compare the change in the earnings per share (EPS) with the share price movement.
During five years of share price growth, Applied Materials achieved compound earnings per share (EPS) growth of 25% per year. This EPS growth is lower than the 33% average annual increase in the share price. So it's fair to assume the market has a higher opinion of the business than it did five years ago. And that's hardly shocking given the track record of growth.
The image below shows how EPS has tracked over time (if you click on the image you can see greater detail).
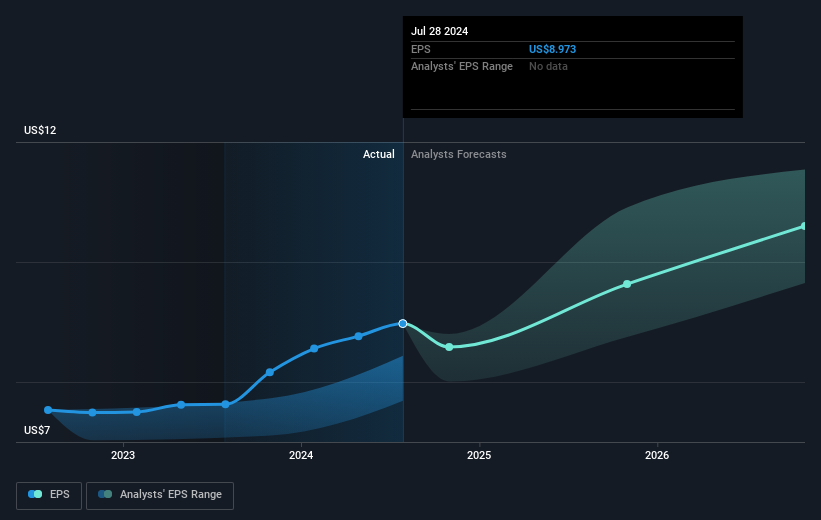
We know that Applied Materials has improved its bottom line lately, but is it going to grow revenue? This free report showing analyst revenue forecasts should help you figure out if the EPS growth can be sustained.
What About Dividends?
It is important to consider the total shareholder return, as well as the share price return, for any given stock. Whereas the share price return only reflects the change in the share price, the TSR includes the value of dividends (assuming they were reinvested) and the benefit of any discounted capital raising or spin-off. It's fair to say that the TSR gives a more complete picture for stocks that pay a dividend. In the case of Applied Materials, it has a TSR of 343% for the last 5 years. That exceeds its share price return that we previously mentioned. The dividends paid by the company have thusly boosted the total shareholder return.
A Different Perspective
It's good to see that Applied Materials has rewarded shareholders with a total shareholder return of 53% in the last twelve months. Of course, that includes the dividend. That's better than the annualised return of 35% over half a decade, implying that the company is doing better recently. Someone with an optimistic perspective could view the recent improvement in TSR as indicating that the business itself is getting better with time. Most investors take the time to check the data on insider transactions. You can click here to see if insiders have been buying or selling.
We will like Applied Materials better if we see some big insider buys. While we wait, check out this free list of undervalued stocks (mostly small caps) with considerable, recent, insider buying.
Please note, the market returns quoted in this article reflect the market weighted average returns of stocks that currently trade on American exchanges.
New: Manage All Your Stock Portfolios in One Place
We've created the ultimate portfolio companion for stock investors, and it's free.
• Connect an unlimited number of Portfolios and see your total in one currency
• Be alerted to new Warning Signs or Risks via email or mobile
• Track the Fair Value of your stocks
Have feedback on this article? Concerned about the content? Get in touch with us directly. Alternatively, email editorial-team (at) simplywallst.com.
This article by Simply Wall St is general in nature. We provide commentary based on historical data and analyst forecasts only using an unbiased methodology and our articles are not intended to be financial advice. It does not constitute a recommendation to buy or sell any stock, and does not take account of your objectives, or your financial situation. We aim to bring you long-term focused analysis driven by fundamental data. Note that our analysis may not factor in the latest price-sensitive company announcements or qualitative material. Simply Wall St has no position in any stocks mentioned.
About NasdaqGS:AMAT
Applied Materials
Engages in the provision of manufacturing equipment, services, and software to the semiconductor, display, and related industries.
Flawless balance sheet with solid track record and pays a dividend.

