Advertisement
- United States
- /
- Office REITs
- /
- NYSE:BXP
Is BXP Attractively Priced After Recent Share Decline and Volatile Market Moves?

Simply Wall St
Reviewed by Bailey Pemberton
- Ever wondered if BXP is attractively priced right now? Whether you are bargain hunting or just want to avoid overpaying, it is a question worth asking.
- BXP shares recently closed at $69.73 and have seen some volatility, dropping 5.9% in the last week and 7.8% over the past month, with a year-to-date move of -5.4% and a one-year decline of 9.8%. Despite this, there has been a 16.4% gain over three years.
- Much of this movement has followed headlines about the shifting outlook for commercial real estate, amid changing work habits and evolving investor sentiment on office properties. Analysts and investors have debated whether these trends create fresh opportunities or new challenges for BXP’s portfolio.
- Based on our 6-point valuation framework, BXP earns a score of 4 for being undervalued in 4 out of 6 checks. We will explain exactly how those numbers are calculated and why numbers alone might not tell the whole valuation story by the end of the article.
Approach 1: BXP Discounted Cash Flow (DCF) Analysis
The Discounted Cash Flow (DCF) model estimates a company's intrinsic value by projecting its expected adjusted funds from operations and then discounting those future cash flows back to their present value. This approach helps investors gauge what a company is really worth based on its ability to generate cash over time, rather than just relying on current market sentiment.
For BXP, the latest reported free cash flow stands at $1.12 Billion. Analyst forecasts inform cash flow projections through 2029, with a gradual annual increase and a projected $1.13 Billion by 2035 according to Simply Wall St extrapolations. While analysts provide direct forecasts up to 2029, figures beyond that are generated based on estimated long-term growth rates. This adds a degree of uncertainty but is helpful for forming a broad valuation picture.
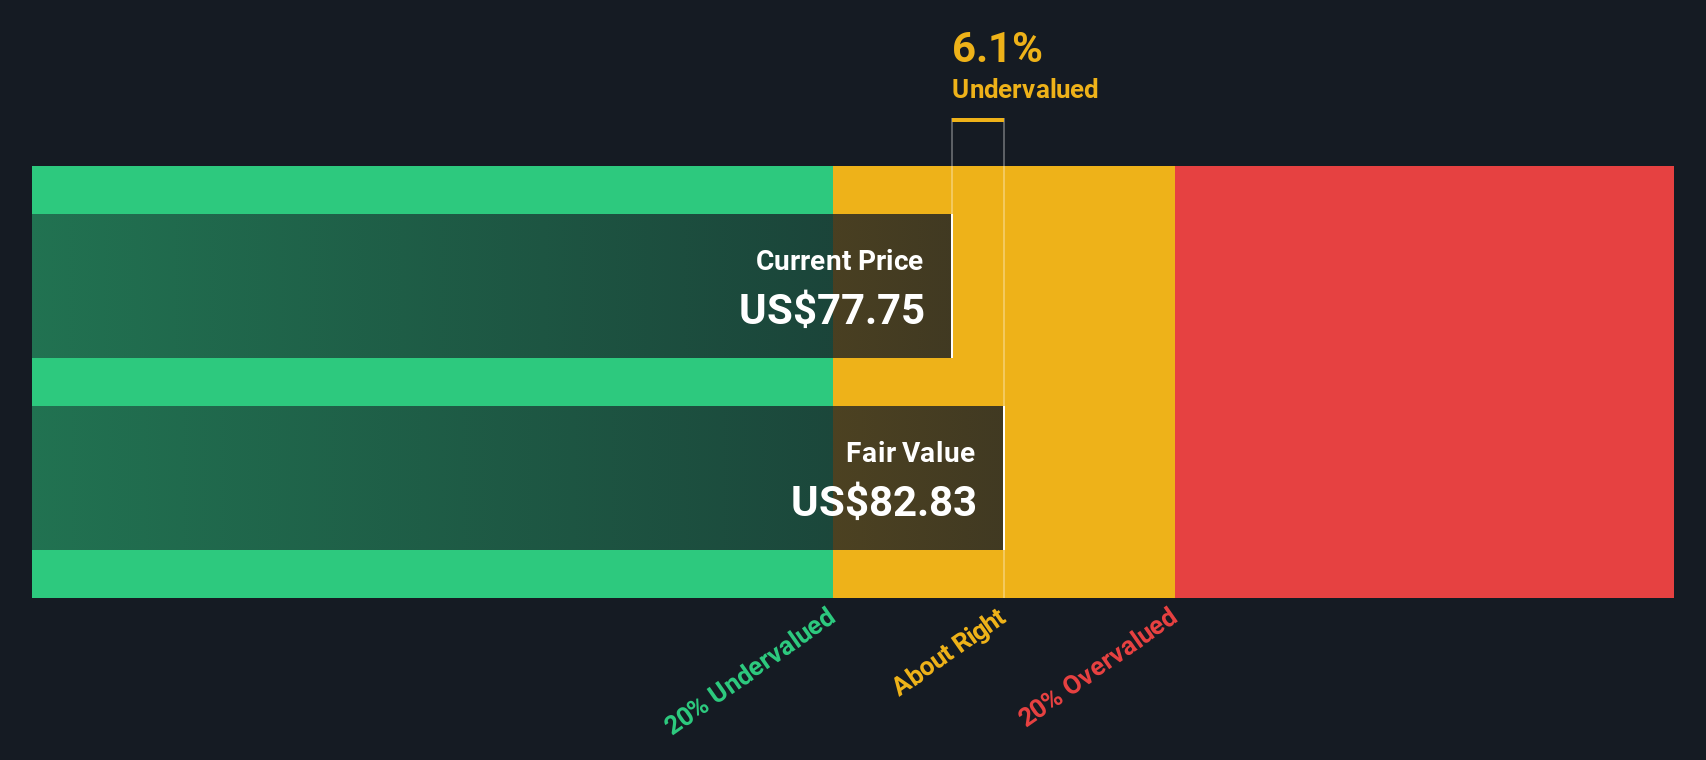
Using this framework, the intrinsic value per share is estimated at $90.85. With BXP’s recent closing price at $69.73, the DCF model suggests BXP is trading at a 23.2% discount to its intrinsic value.
Result: UNDERVALUED
Our Discounted Cash Flow (DCF) analysis suggests BXP is undervalued by 23.2%. Track this in your watchlist or portfolio, or discover 840 more undervalued stocks based on cash flows.
Approach 2: BXP Price vs Sales
For real estate investment trusts like BXP, the Price-to-Sales (P/S) ratio is a useful valuation tool, especially when profitability varies or when companies reinvest heavily. The P/S ratio compares a company’s market capitalization to its revenue, offering a straightforward way to gauge what investors are paying for each dollar of sales. It also tends to be less volatile than profit-based metrics, making it particularly suitable for the Office REITs sector.
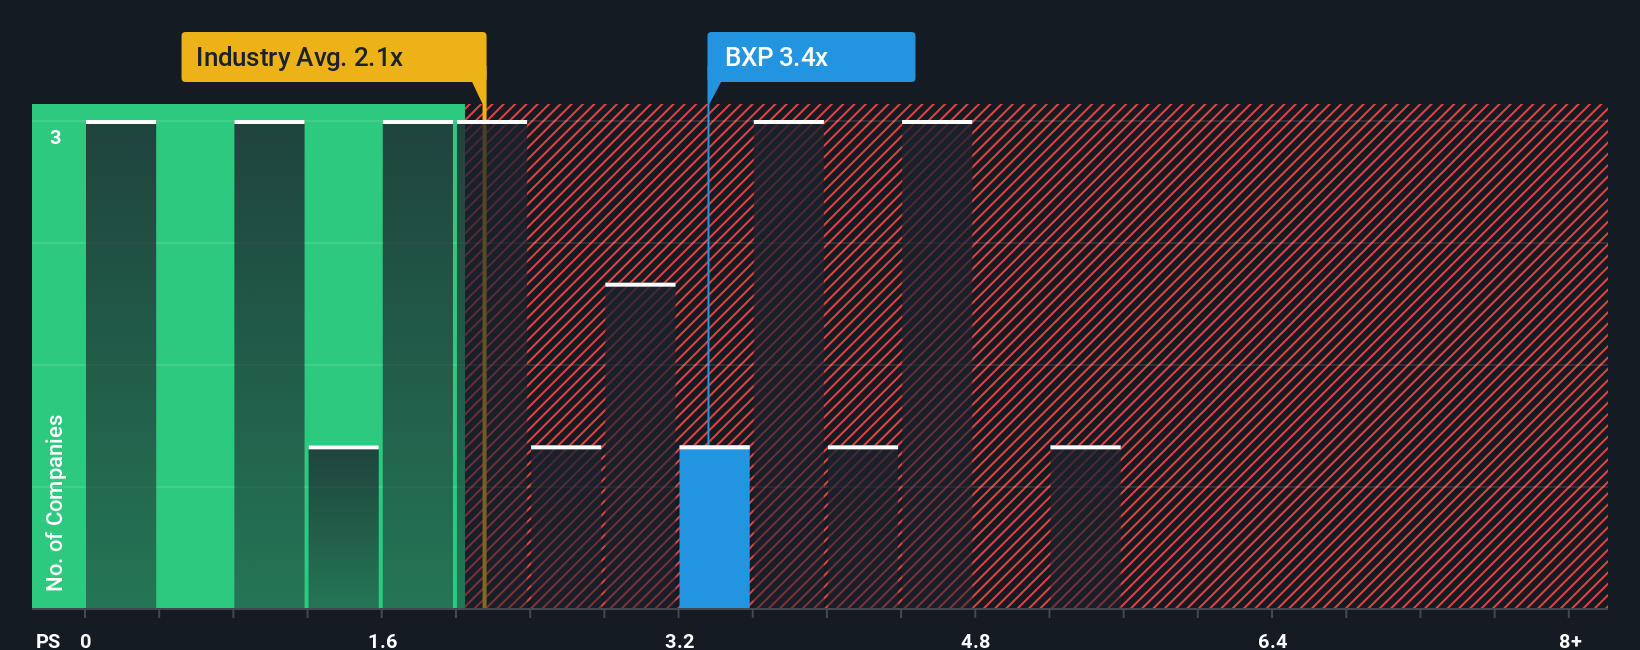
Growth expectations and risk play a central role in deciding what a normal or fair P/S ratio looks like. Higher anticipated revenue growth or lower business risk typically justify a higher multiple. Stagnant sales or volatility warrant lower figures. In BXP’s case, its current P/S ratio stands at 3.37x, which is noticeably above the Office REITs industry average of 2.14x but below the peer group average of 4.21x.
Simply Wall St’s Fair Ratio for BXP is calculated at 4.54x. Unlike basic industry or peer comparisons, the Fair Ratio factors in not just sector trends, but also BXP’s specific financials, growth prospects, margins, market cap, and risk profile. This more holistic measure is designed to offer a benchmark tailored to BXP’s individual situation and provides a fairer and more actionable comparison.
BXP’s current P/S of 3.37x being below the Fair Ratio of 4.54x suggests the stock may be undervalued relative to what would be expected given its outlook and characteristics.
Result: UNDERVALUED
PS ratios tell one story, but what if the real opportunity lies elsewhere? Discover 1411 companies where insiders are betting big on explosive growth.
Upgrade Your Decision Making: Choose your BXP Narrative
Earlier we mentioned that there is an even better way to understand valuation, so let's introduce you to Narratives. A Narrative is your personal story or perspective about a company, explaining why you think it deserves a certain fair value, with your own assumptions about future revenue, earnings, and margins layered in. Rather than just relying on static numbers, Narratives connect your view of a company’s real-world story to financial forecasts and then to fair value, making investment decisions more meaningful and tailored to you.
Narratives are an easy and accessible tool available within the Simply Wall St Community page, used regularly by millions of investors. They let you document your outlook for BXP, compare your calculated Fair Value to the current market Price, and adjust your conviction as new data, news, or earnings emerge. Since Narratives are updated dynamically with each new development, you are always working from a current and relevant picture.
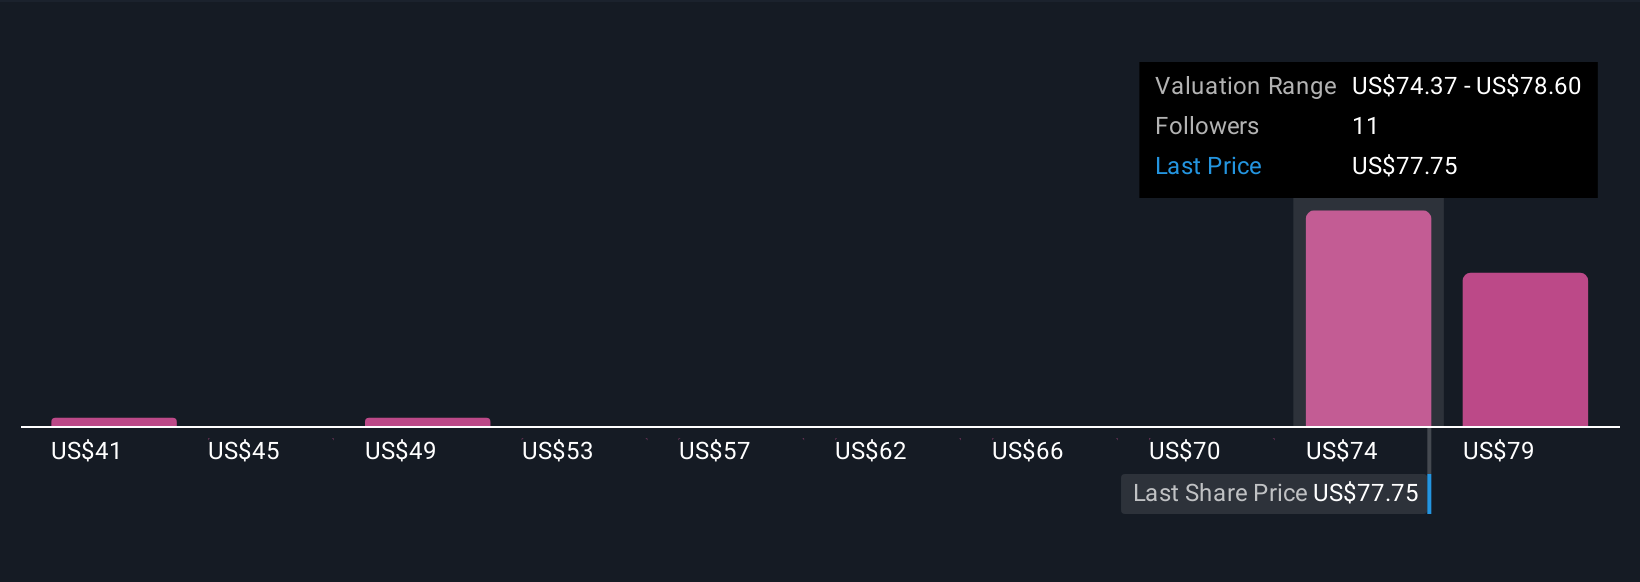
For example, one investor might see BXP’s gateway market offices and rising AI-driven tenant demand as reasons to assign a fair value near $91, while another might focus on sector headwinds and assign a value closer to $65. Narratives make it simple to see, share, and update these perspectives, helping you decide with confidence when it is time to buy or sell.
Do you think there's more to the story for BXP? Head over to our Community to see what others are saying!
This article by Simply Wall St is general in nature. We provide commentary based on historical data and analyst forecasts only using an unbiased methodology and our articles are not intended to be financial advice. It does not constitute a recommendation to buy or sell any stock, and does not take account of your objectives, or your financial situation. We aim to bring you long-term focused analysis driven by fundamental data. Note that our analysis may not factor in the latest price-sensitive company announcements or qualitative material. Simply Wall St has no position in any stocks mentioned.
Valuation is complex, but we're here to simplify it.
Discover if BXP might be undervalued or overvalued with our detailed analysis, featuring fair value estimates, potential risks, dividends, insider trades, and its financial condition.
Access Free AnalysisHave feedback on this article? Concerned about the content? Get in touch with us directly. Alternatively, email editorial-team@simplywallst.com
About NYSE:BXP
BXP
BXP, Inc. (NYSE: BXP) is the largest publicly traded developer, owner, and manager of premier workplaces in the United States, concentrated in six dynamic gateway markets - Boston, Los Angeles, New York, San Francisco, Seattle, and Washington, DC.
Established dividend payer and good value.
Similar Companies
Market Insights

Advertisement
Community Narratives
The "Molecular Pencil": Why Beam's Technology is Built to Win
Fair Value US$65.01|65.4% undervalued
DA
Community Contributor
The silent giant behind virtually every advanced chip powering AI, smartphones, and modern infrastructure.
Fair Value US$310.00|6.1% undervalued
OS
Community Contributor
ADP Stock: Solid Fundamentals, But AI Investments Test Its Margin Resilience
Fair Value US$387.77|34.2% undervalued
YI
Community Contributor
MINISO's fair value is projected at 26.69 with an anticipated PE ratio shift of 20x
Fair Value US$24.03|9.6% undervalued
BE
Community Contributor