- United States
- /
- Biotech
- /
- NasdaqGM:MNOV
MediciNova (NASDAQ:MNOV) adds US$7.8m to market cap in the past 7 days, though investors from five years ago are still down 85%


This week we saw the MediciNova, Inc. (NASDAQ:MNOV) share price climb by 13%. But that doesn't change the fact that the returns over the last half decade have been stomach churning. Indeed, the share price is down a whopping 85% in that time. So we don't gain too much confidence from the recent recovery. The million dollar question is whether the company can justify a long term recovery. We really feel for shareholders in this scenario. It's a good reminder of the importance of diversification, and it's worth keeping in mind there's more to life than money, anyway.
Although the past week has been more reassuring for shareholders, they're still in the red over the last five years, so let's see if the underlying business has been responsible for the decline.
Check out our latest analysis for MediciNova
With just US$1,000,000 worth of revenue in twelve months, we don't think the market considers MediciNova to have proven its business plan. You have to wonder why venture capitalists aren't funding it. As a result, we think it's unlikely shareholders are paying much attention to current revenue, but rather speculating on growth in the years to come. It seems likely some shareholders believe that MediciNova has the funding to invent a new product before too long.
Companies that lack both meaningful revenue and profits are usually considered high risk. There is almost always a chance they will need to raise more capital, and their progress - and share price - will dictate how dilutive that is to current holders. While some such companies go on to make revenue, profits, and generate value, others get hyped up by hopeful naifs before eventually going bankrupt. It certainly is a dangerous place to invest, as MediciNova investors might realise.
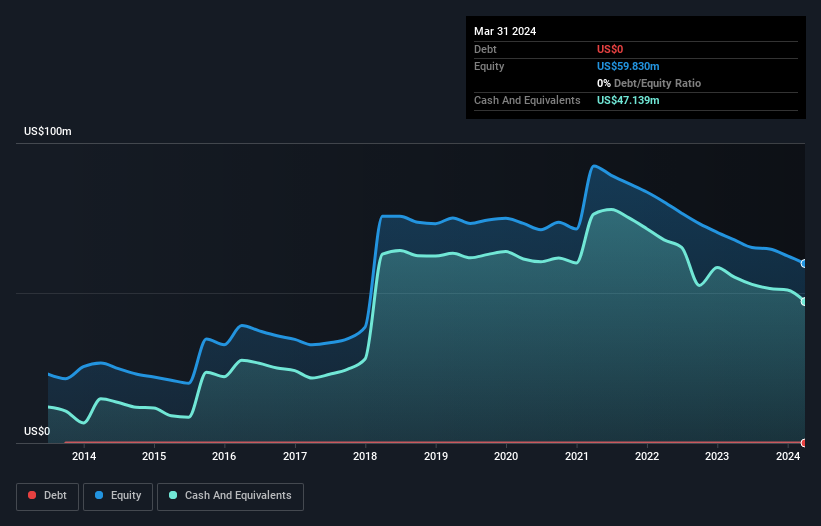
MediciNova has plenty of cash in the bank, with cash in excess of all liabilities sitting at US$44m, when it last reported (March 2024). That allows management to focus on growing the business, and not worry too much about raising capital. But since the share price has dropped 13% per year, over 5 years , it seems like the market might have been over-excited previously. You can see in the image below, how MediciNova's cash levels have changed over time (click to see the values).
Of course, the truth is that it is hard to value companies without much revenue or profit. What if insiders are ditching the stock hand over fist? It would bother me, that's for sure. It only takes a moment for you to check whether we have identified any insider sales recently.
A Different Perspective
Investors in MediciNova had a tough year, with a total loss of 37%, against a market gain of about 25%. However, keep in mind that even the best stocks will sometimes underperform the market over a twelve month period. Unfortunately, last year's performance may indicate unresolved challenges, given that it was worse than the annualised loss of 13% over the last half decade. Generally speaking long term share price weakness can be a bad sign, though contrarian investors might want to research the stock in hope of a turnaround. It's always interesting to track share price performance over the longer term. But to understand MediciNova better, we need to consider many other factors. Case in point: We've spotted 4 warning signs for MediciNova you should be aware of, and 2 of them make us uncomfortable.
If you would prefer to check out another company -- one with potentially superior financials -- then do not miss this free list of companies that have proven they can grow earnings.
Please note, the market returns quoted in this article reflect the market weighted average returns of stocks that currently trade on American exchanges.
New: Manage All Your Stock Portfolios in One Place
We've created the ultimate portfolio companion for stock investors, and it's free.
• Connect an unlimited number of Portfolios and see your total in one currency
• Be alerted to new Warning Signs or Risks via email or mobile
• Track the Fair Value of your stocks
Have feedback on this article? Concerned about the content? Get in touch with us directly. Alternatively, email editorial-team (at) simplywallst.com.
This article by Simply Wall St is general in nature. We provide commentary based on historical data and analyst forecasts only using an unbiased methodology and our articles are not intended to be financial advice. It does not constitute a recommendation to buy or sell any stock, and does not take account of your objectives, or your financial situation. We aim to bring you long-term focused analysis driven by fundamental data. Note that our analysis may not factor in the latest price-sensitive company announcements or qualitative material. Simply Wall St has no position in any stocks mentioned.
Have feedback on this article? Concerned about the content? Get in touch with us directly. Alternatively, email editorial-team@simplywallst.com
About NasdaqGM:MNOV
MediciNova
A biopharmaceutical company, focuses on developing novel and small molecule therapeutics for the treatment of serious diseases with unmet medical needs in the United States.
Flawless balance sheet moderate.

