- United States
- /
- Chemicals
- /
- NYSE:APD
Air Products and Chemicals' (NYSE:APD) earnings growth rate lags the 4.9% CAGR delivered to shareholders

The main point of investing for the long term is to make money. But more than that, you probably want to see it rise more than the market average. Unfortunately for shareholders, while the Air Products and Chemicals, Inc. (NYSE:APD) share price is up 14% in the last five years, that's less than the market return. The last year has been disappointing, with the stock price down 9.5% in that time.
While the stock has fallen 4.0% this week, it's worth focusing on the longer term and seeing if the stocks historical returns have been driven by the underlying fundamentals.
Check out our latest analysis for Air Products and Chemicals
In his essay The Superinvestors of Graham-and-Doddsville Warren Buffett described how share prices do not always rationally reflect the value of a business. By comparing earnings per share (EPS) and share price changes over time, we can get a feel for how investor attitudes to a company have morphed over time.
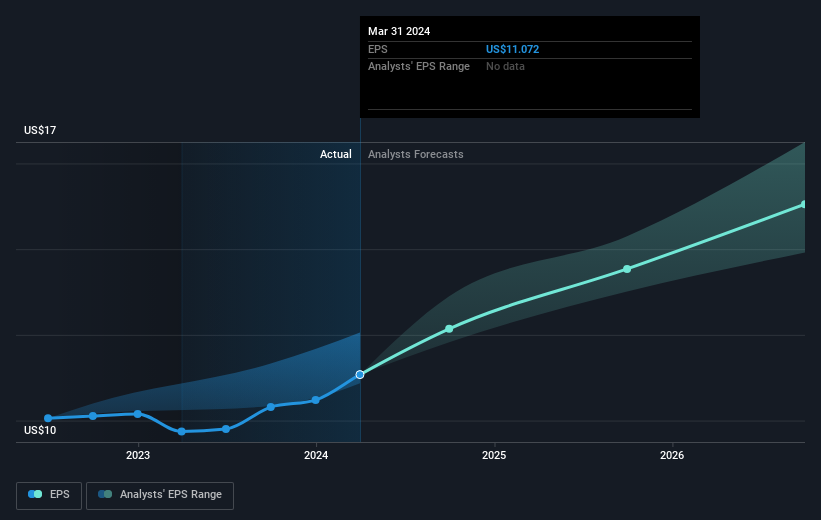
Over half a decade, Air Products and Chemicals managed to grow its earnings per share at 8.1% a year. The EPS growth is more impressive than the yearly share price gain of 3% over the same period. So one could conclude that the broader market has become more cautious towards the stock.
You can see how EPS has changed over time in the image below (click on the chart to see the exact values).
We like that insiders have been buying shares in the last twelve months. Having said that, most people consider earnings and revenue growth trends to be a more meaningful guide to the business. Before buying or selling a stock, we always recommend a close examination of historic growth trends, available here..
What About Dividends?
As well as measuring the share price return, investors should also consider the total shareholder return (TSR). The TSR is a return calculation that accounts for the value of cash dividends (assuming that any dividend received was reinvested) and the calculated value of any discounted capital raisings and spin-offs. Arguably, the TSR gives a more comprehensive picture of the return generated by a stock. In the case of Air Products and Chemicals, it has a TSR of 27% for the last 5 years. That exceeds its share price return that we previously mentioned. The dividends paid by the company have thusly boosted the total shareholder return.
A Different Perspective
While the broader market gained around 25% in the last year, Air Products and Chemicals shareholders lost 7.1% (even including dividends). Even the share prices of good stocks drop sometimes, but we want to see improvements in the fundamental metrics of a business, before getting too interested. Longer term investors wouldn't be so upset, since they would have made 5%, each year, over five years. It could be that the recent sell-off is an opportunity, so it may be worth checking the fundamental data for signs of a long term growth trend. It's always interesting to track share price performance over the longer term. But to understand Air Products and Chemicals better, we need to consider many other factors. Even so, be aware that Air Products and Chemicals is showing 3 warning signs in our investment analysis , and 1 of those is potentially serious...
Air Products and Chemicals is not the only stock insiders are buying. So take a peek at this free list of small cap companies at attractive valuations which insiders have been buying.
Please note, the market returns quoted in this article reflect the market weighted average returns of stocks that currently trade on American exchanges.
New: Manage All Your Stock Portfolios in One Place
We've created the ultimate portfolio companion for stock investors, and it's free.
• Connect an unlimited number of Portfolios and see your total in one currency
• Be alerted to new Warning Signs or Risks via email or mobile
• Track the Fair Value of your stocks
Have feedback on this article? Concerned about the content? Get in touch with us directly. Alternatively, email editorial-team (at) simplywallst.com.
This article by Simply Wall St is general in nature. We provide commentary based on historical data and analyst forecasts only using an unbiased methodology and our articles are not intended to be financial advice. It does not constitute a recommendation to buy or sell any stock, and does not take account of your objectives, or your financial situation. We aim to bring you long-term focused analysis driven by fundamental data. Note that our analysis may not factor in the latest price-sensitive company announcements or qualitative material. Simply Wall St has no position in any stocks mentioned.
Have feedback on this article? Concerned about the content? Get in touch with us directly. Alternatively, email editorial-team@simplywallst.com
About NYSE:APD
Air Products and Chemicals
Provides atmospheric gases, process and specialty gases, equipment, and related services in the Americas, Asia, Europe, the Middle East, India, and internationally.
Solid track record, good value and pays a dividend.

