W. R. Berkley (WRB) has quietly continued to deliver steady performance, with shares posting a solid return over the past year. Investors watching the insurance sector may find its consistent profit growth and gradual revenue increases worth a closer look.
W. R. Berkley’s share price has climbed steadily, now sitting at $77.00, as investors continue to reward its consistent profit and revenue growth. Momentum is clearly building, with a 32.74% year-to-date price return and an impressive 29.35% total return for shareholders over the past year. This reinforces confidence in its long-term prospects.
If you’re wondering what else could offer this kind of persistent growth, it might be the perfect moment to broaden your search and discover fast growing stocks with high insider ownership
But with W. R. Berkley trading above analyst targets, investors may wonder if the stock remains undervalued or if strong results have already been fully factored in. Investors may question whether there is still a buying opportunity or if future growth is mostly priced in.
Advertisement
Most Popular Narrative: 3% Overvalued
The widely followed narrative now places W. R. Berkley's fair value at just under its last close, signaling a cautious reappraisal as the share price edges above consensus expectations.
Prudent capital management, shown by a growing investment portfolio benefiting from higher new money yields and conservative reserving, is increasing investment income and book value per share. This is laying a foundation for higher long-term earnings and the potential for resumed share buybacks.
Want to know the financial logic at work? This narrative relies on outpacing peers through disciplined capital moves and a projected profit margin lift. But what else is driving the premium price? Tap to see the future earnings assumptions and find out why analysts expect the valuation gap to shrink.
However, intensifying competition and unexpected inflation trends could put pressure on W. R. Berkley’s margins and challenge the optimistic outlook for continued steady growth.
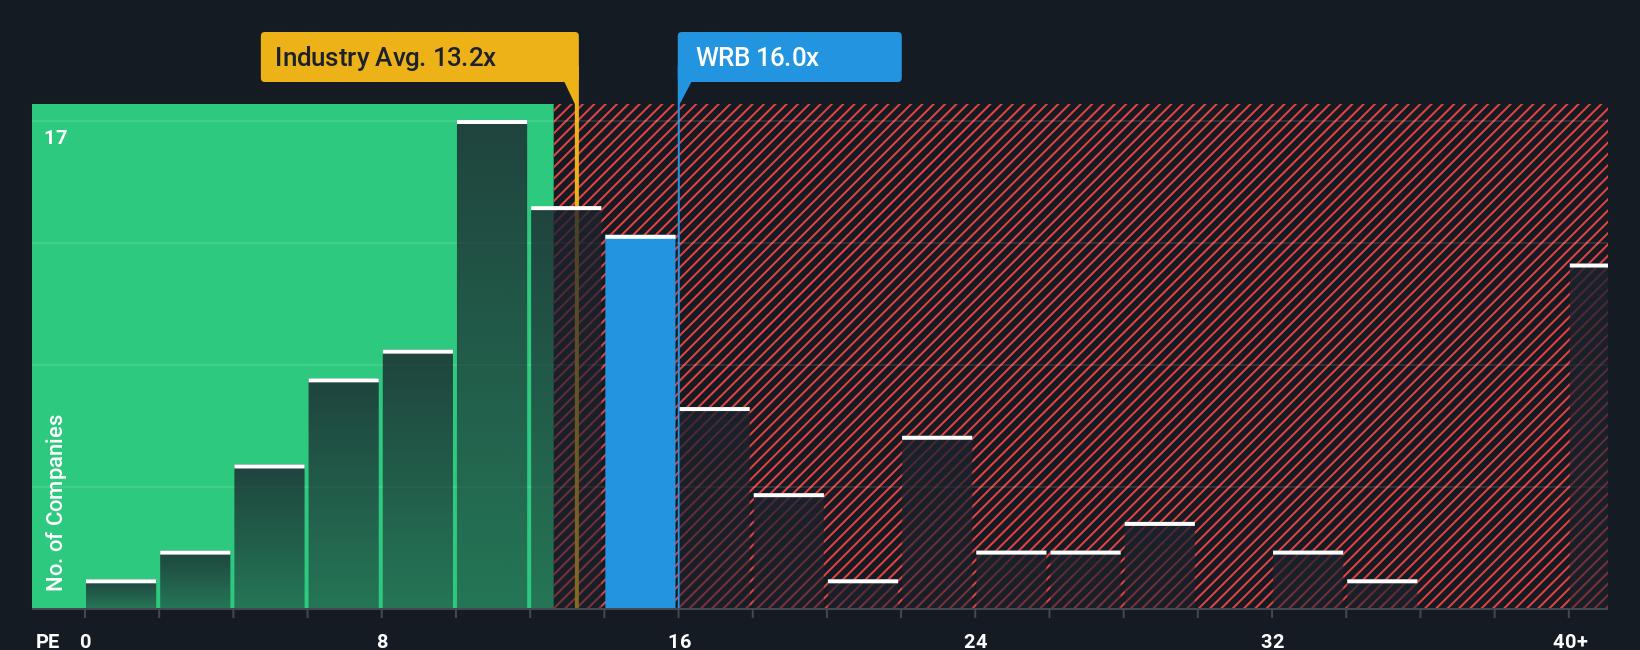
While the fair value estimate suggests W. R. Berkley might be almost fully priced in, a look at its price-to-earnings ratio paints a more expensive picture. The stock trades at 15.4x earnings, noticeably higher than the industry average of 13.2x and its fair ratio of 11.7x. This premium means investors are paying extra for stability and potential. Still, the question remains whether the current optimism is justified or if there is more risk than meets the eye.
If you see things differently or want to put your own analysis to the test, you can quickly craft your narrative in just a few minutes. Do it your way
A great starting point for your W. R. Berkley research is our analysis highlighting 2 key rewards and 1 important warning sign that could impact your investment decision.
Looking for More Investment Ideas?
Make smarter moves by uncovering other potential winners. The market has plenty more to offer, and you only need the right insights to find them.
Tap opportunities in cutting-edge AI businesses and see which names make the shortlist with these 25 AI penny stocks.
This article by Simply Wall St is general in nature. We provide commentary based on historical data
and analyst forecasts only using an unbiased methodology and our articles are not intended to be financial advice. It does not constitute a recommendation to buy or sell any stock, and does not take account of your objectives, or your
financial situation. We aim to bring you long-term focused analysis driven by fundamental data.
Note that our analysis may not factor in the latest price-sensitive company announcements or qualitative material.
Simply Wall St has no position in any stocks mentioned.
Valuation is complex, but we're here to simplify it.
Discover if W. R. Berkley might be undervalued or overvalued with our detailed analysis, featuring fair value estimates, potential risks, dividends, insider trades, and its financial condition.