Advertisement
- United States
- /
- Insurance
- /
- NYSE:CB
Is Chubb a Bargain Amid Strategic Expansion and Recent Price Dip?

Simply Wall St
Reviewed by Bailey Pemberton
- Wondering if Chubb is trading at a fair price, or if there's untapped value hiding in plain sight? You're not alone. Let's take a closer look at what's happening behind the scenes.
- Chubb's share price has dipped slightly with a -1.8% return over the past week and -1.6% over the past month. However, it's still up 1.6% year-to-date and has delivered an impressive 117.7% over five years.
- Recent headlines have highlighted Chubb's strategic moves and expansion efforts, catching the attention of both investors and competitors. These updates set the stage for why understanding its valuation matters more than ever right now.
- On our core valuation checks, Chubb scores a 4 out of 6. This signals value in multiple areas but still leaves questions to explore. Let's break down the standard valuation tools, and later on, we'll reveal an even smarter way to think about what Chubb is really worth.
Approach 1: Chubb Excess Returns Analysis
The Excess Returns model evaluates how effectively a company generates value above the cost of its equity capital. By comparing Chubb’s return on invested capital to its cost of equity, investors gain an important perspective on long-term value creation potential. If the return on equity outpaces the required return, the company can compound shareholder wealth in a sustainable way.
For Chubb, the figures are compelling. Its current Book Value stands at $182.22 per share, and analysts estimate a Stable EPS (earnings per share) of $28.63, based on weighted future Return on Equity assessments from 14 analysts. The company’s Cost of Equity is $13.58 per share, with an Excess Return of $15.05 per share indicating substantial value generation over what investors demand. Chubb’s average Return on Equity is currently 13.6%, underlining consistent profitability. Looking forward, the stable Book Value is forecast to grow to $210.54 per share, based on projections from 13 analysts.
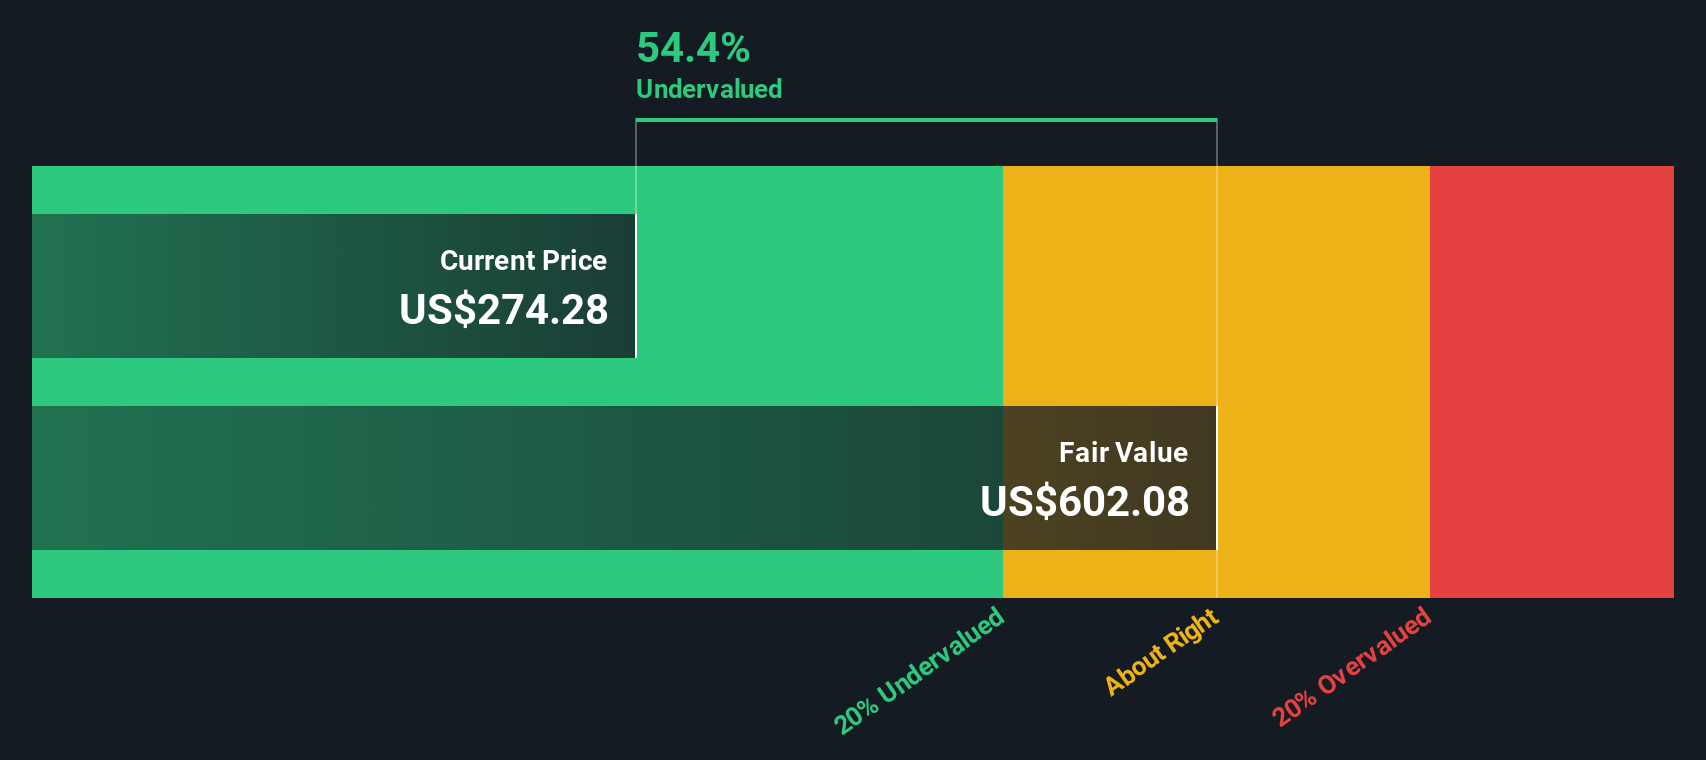
Based on this model, Chubb’s estimated intrinsic value is significantly higher than its current share price, with an implied discount of 57.9%. This strongly suggests the stock is undervalued by the market.
Result: UNDERVALUED
Our Excess Returns analysis suggests Chubb is undervalued by 57.9%. Track this in your watchlist or portfolio, or discover 832 more undervalued stocks based on cash flows.
Approach 2: Chubb Price vs Earnings
The price-to-earnings (PE) ratio is widely considered the go-to valuation metric for profitable companies like Chubb, since it draws a direct link between what investors pay and the company’s current earnings power. Given Chubb’s consistent profitability, comparing the PE ratio helps investors gauge how the market values its bottom line relative to peers and expected growth.
A company’s “normal” or fair PE ratio reflects not just its current performance, but also future earnings growth prospects and any risks unique to its industry or business model. Faster growth, lower risk, and higher quality usually justify higher PE multiples; slower growth or higher risk tends to pull them lower.
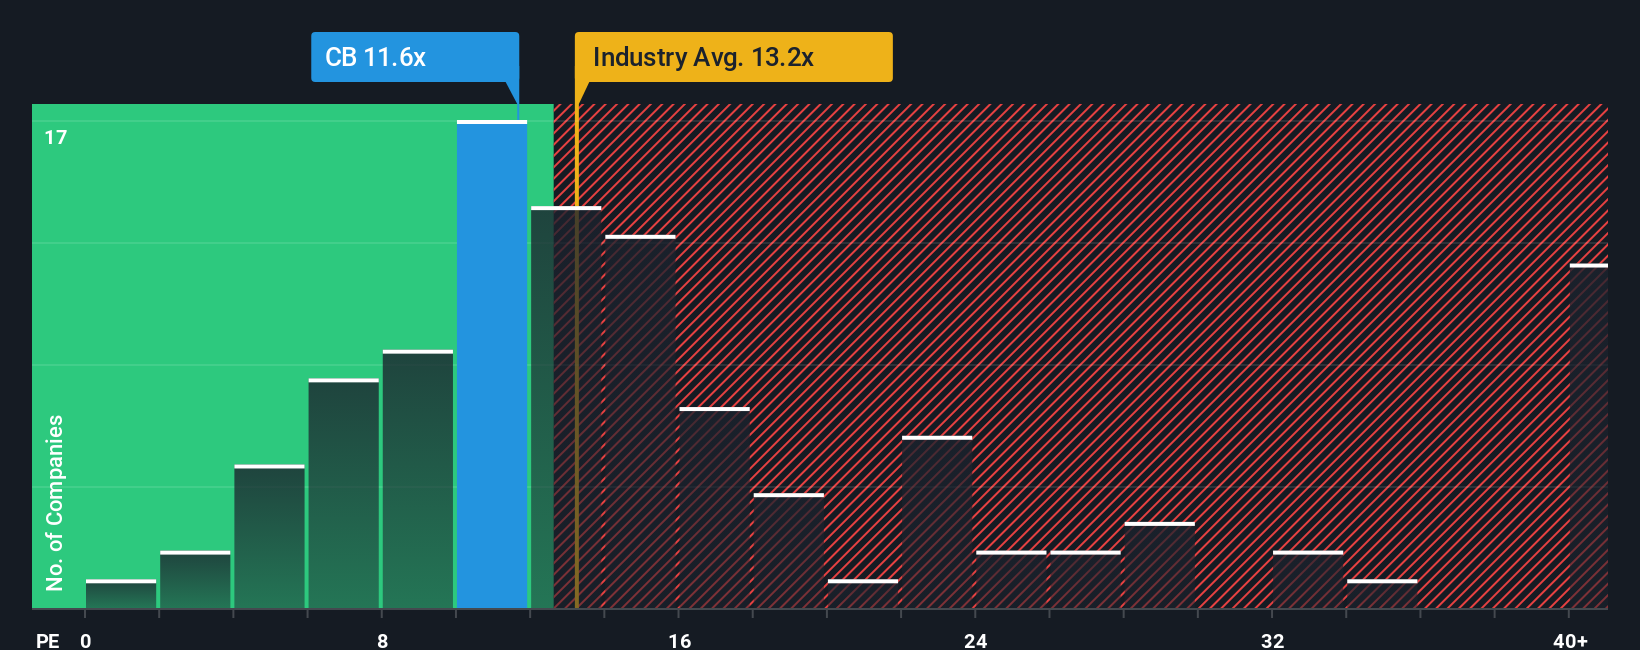
Chubb currently trades on a PE multiple of 11.27x. For context, the industry average PE for insurance is 13.34x, and the peer group average is 10.05x. This puts Chubb’s valuation just above peers but below the industry standard, suggesting the market sees its earnings growth and stability as solid, but perhaps not stellar.
To dig deeper, Simply Wall St calculates a proprietary “Fair Ratio” for Chubb, which factors in more than just basic comparisons. Unlike a plain peer or sector average, the Fair Ratio accounts for Chubb’s unique earnings growth, profit margin, industry landscape, company size, and risk profile. For Chubb, the Fair Ratio stands at 14.49x. In other words, based on its attributes and outlook, you could expect a higher PE than where the stock trades right now.
With Chubb’s PE of 11.27x sitting noticeably below its Fair Ratio of 14.49x, the shares appear fundamentally undervalued on this metric.
Result: UNDERVALUED
PE ratios tell one story, but what if the real opportunity lies elsewhere? Discover 1410 companies where insiders are betting big on explosive growth.
Upgrade Your Decision Making: Choose your Chubb Narrative
Earlier we mentioned that there’s an even better way to understand valuation, so let’s introduce you to Narratives. A Narrative is your own unique investment story for a company like Chubb, simply expressed by outlining what you think the business will achieve, such as its future revenue, earnings, and profit margins, and how much you believe it’s really worth. Narratives connect a company’s story to financial forecasts and then directly to an estimated fair value, empowering you to see not just the numbers, but the reasoning and expectations behind them.
On Simply Wall St’s Community page, millions of investors use Narratives to quickly build and compare investing stories. Narratives make investment decisions more transparent and accessible by showing at a glance whether a share appears under- or overvalued based on your expectations, letting you decide when to buy or sell by comparing your Fair Value to the latest price. They are updated dynamically in real-time as new earnings, news, or company events unfold, so your perspective is always current and relevant.
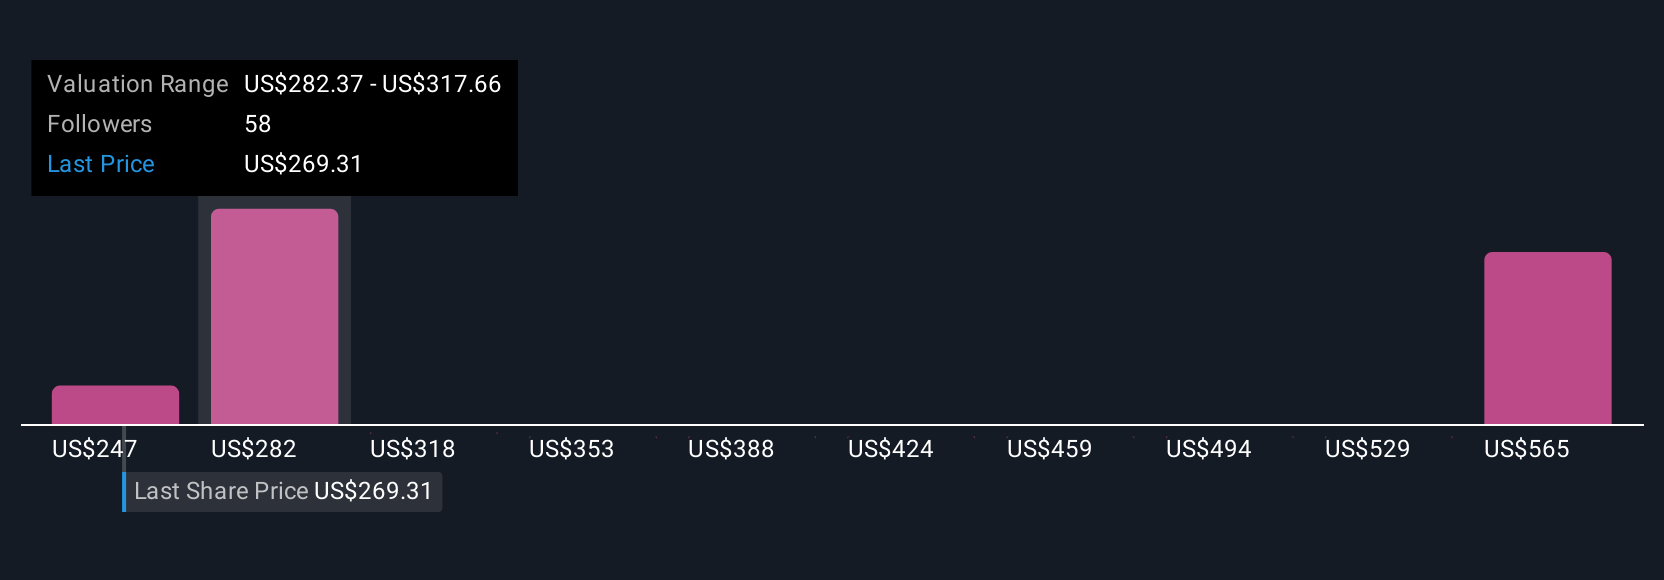
For example, one investor might use bullish estimates to argue Chubb should be valued at $340 per share, anticipating strong international growth and margin expansion. Another investor with a more cautious outlook could argue for a $267 price target, focusing on competition and regulatory risks. Your Narrative helps you discover your own conviction, grounded in your assumptions.
For Chubb, however, we'll make it really easy for you with previews of two leading Chubb Narratives:
- 🐂 Chubb Bull Case
Fair Value: $306.64
Current price is 9.7% below fair value
Expected Revenue Growth: -4.7%
- Expansion in international markets and digital innovation are fueling Chubb’s revenue and earnings growth. Disciplined underwriting and strong shareholder returns support sustained profitability.
- Despite facing market competition, catastrophe risks, and regulatory pressures, analysts expect profit margins to increase, earnings to rise modestly, and the company to reduce its share count.
- Analyst consensus price targets suggest the stock is close to fair value. Investors are encouraged to assess the company’s outlook based on their own expectations for revenue, margins, and risk.
- 🐻 Chubb Bear Case
Fair Value: $247.08
Current price is 12.1% above fair value
Expected Revenue Growth: 2.6%
- Chubb excels globally with diversified insurance offerings and strong financial ratings but operates in a highly competitive and tightly regulated environment with significant pressure from industry giants and insurtech disruptors.
- The company benefits from capital strength, global reach, and investment income. However, it faces moderate threats from new entrants, substitutes, and evolving risk management strategies.
- Growth is driven by emerging markets, tech innovation, and product diversification. Still, Chubb is exposed to risks such as catastrophes, regulatory shifts, climate change, and operational challenges that could impact profitability.
Do you think there's more to the story for Chubb? Head over to our Community to see what others are saying!
This article by Simply Wall St is general in nature. We provide commentary based on historical data and analyst forecasts only using an unbiased methodology and our articles are not intended to be financial advice. It does not constitute a recommendation to buy or sell any stock, and does not take account of your objectives, or your financial situation. We aim to bring you long-term focused analysis driven by fundamental data. Note that our analysis may not factor in the latest price-sensitive company announcements or qualitative material. Simply Wall St has no position in any stocks mentioned.
New: AI Stock Screener & Alerts
Our new AI Stock Screener scans the market every day to uncover opportunities.
• Dividend Powerhouses (3%+ Yield)
• Undervalued Small Caps with Insider Buying
• High growth Tech and AI Companies
Or build your own from over 50 metrics.
Have feedback on this article? Concerned about the content? Get in touch with us directly. Alternatively, email editorial-team@simplywallst.com
About NYSE:CB
Good value with adequate balance sheet and pays a dividend.
Similar Companies
Market Insights

Advertisement
Community Narratives
The company that turned a verb into a global necessity and basically runs the modern internet, digital ads, smartphones, maps, and AI.
Fair Value US$300.00|6.3% undervalued
OS
Community Contributor
Flowers Foods Pays A Fair Price For Health
Fair Value US$16.12|26.0% undervalued
NV
Community Contributor
TMX Group will thrive with 33.3% profit margin and enduring market moat
Fair Value CA$49.90|3.7% overvalued
LI
Community Contributor