Advertisement
- United States
- /
- Insurance
- /
- NYSE:AFG
A Fresh Look at American Financial Group (AFG) Valuation Following Recent Share Price Momentum

Simply Wall St
Reviewed by Simply Wall St
American Financial Group (AFG) stock has seen some movement lately, sparking curiosity among investors about how its recent performance lines up with broader market trends. As the company continues to navigate the insurance landscape, its share price changes offer some insights for shareholders.
See our latest analysis for American Financial Group.
Recent share price momentum for American Financial Group stands out, especially with a one-week share price return of 8.6% and a 10.5% total shareholder return over the past year as investors respond to shifts in risk perception and earnings strength. The stock’s long-term performance remains impressive, with multi-year total returns continuing to reflect solid value creation.
If today’s move has you looking for what else could be outperforming, now is a perfect time to explore fast growing stocks with high insider ownership
But with shares now trading near analyst price targets, the real question is whether American Financial Group remains undervalued or if the market has already factored in its future prospects, which could leave limited room for upside.
Most Popular Narrative: 4.1% Overvalued
Compared to the last close price of $143.06, the most-followed narrative estimates a fair value of $137.40 per share, which is slightly lower. The debate centers on whether stable earnings prospects and steadily growing dividends truly justify the current premium.
The combination of higher interest rates, which are boosting net investment income on the $16B portfolio, and continued strong capital management with regular dividends and share buybacks is expected to enhance bottom-line earnings and support per-share earnings growth.
What underpins these bullish assumptions? There is a bold blueprint fueling this valuation, rooted in robust profit margin targets, shrinking share count, and confidence in future earnings. Intrigued by what the narrative expects for revenue trends and the profit multiple placed on future results? Only the full narrative reveals these details.
Result: Fair Value of $137.40 (OVERVALUED)
Have a read of the narrative in full and understand what's behind the forecasts.
However, if elevated catastrophe losses persist or if alternative investment returns remain volatile, profitability and future earnings growth could face unexpected pressure.
Find out about the key risks to this American Financial Group narrative.
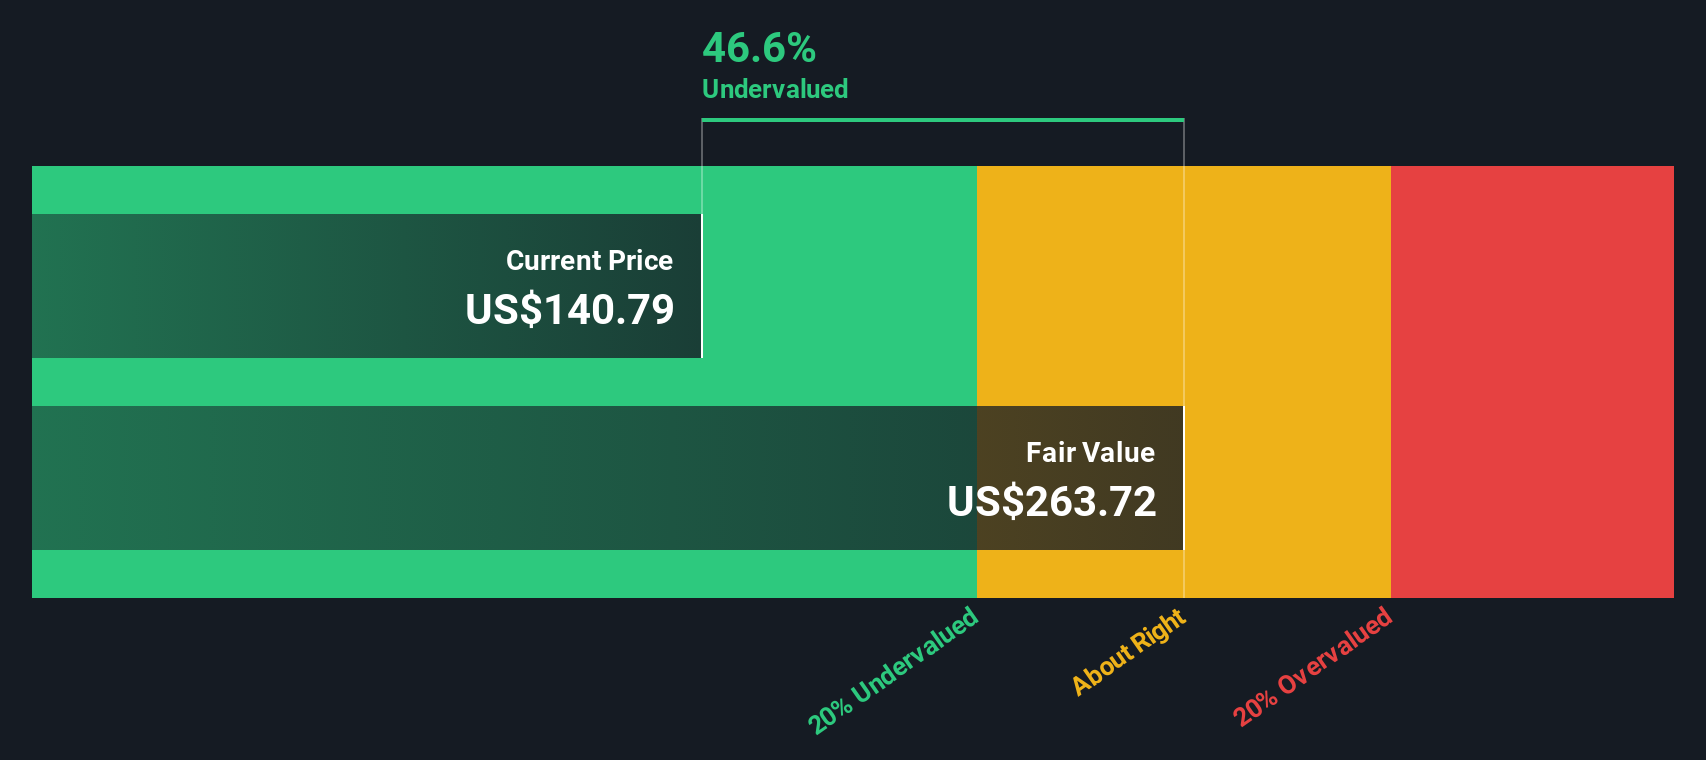
Another View: Discounted Cash Flow Paints a Contrasting Picture
While analysts lean toward American Financial Group being slightly overvalued based on multiples, our SWS DCF model suggests a different story. The DCF analysis puts fair value much higher than current prices, which indicates potential undervaluation. Can intrinsic value and market pricing really be this far apart?
Look into how the SWS DCF model arrives at its fair value.
Simply Wall St performs a discounted cash flow (DCF) on every stock in the world every day (check out American Financial Group for example). We show the entire calculation in full. You can track the result in your watchlist or portfolio and be alerted when this changes, or use our stock screener to discover 870 undervalued stocks based on their cash flows. If you save a screener we even alert you when new companies match - so you never miss a potential opportunity.
Build Your Own American Financial Group Narrative
If you would rather form your own opinion or dig deeper into the numbers, it takes just a few minutes to build a personalized narrative. Do it your way
A great starting point for your American Financial Group research is our analysis highlighting 2 key rewards and 2 important warning signs that could impact your investment decision.
Looking for More Smart Investment Ideas?
Don’t limit your portfolio to just one stock. Expand your horizons with investment themes you might be missing. The Simply Wall St Screener makes it easier than ever to act on bold new trends, opportunities, and future movers.
- Tap into future tech innovation and get ahead by following these 24 AI penny stocks, which are setting new benchmarks in artificial intelligence advancements.
- Capitalize on strong cash flow potential by searching through these 870 undervalued stocks based on cash flows to find companies trading below their intrinsic value right now.
- Seize the chance to grow your passive income with these 16 dividend stocks with yields > 3%, featuring stocks with impressive yields that could boost your returns.
This article by Simply Wall St is general in nature. We provide commentary based on historical data and analyst forecasts only using an unbiased methodology and our articles are not intended to be financial advice. It does not constitute a recommendation to buy or sell any stock, and does not take account of your objectives, or your financial situation. We aim to bring you long-term focused analysis driven by fundamental data. Note that our analysis may not factor in the latest price-sensitive company announcements or qualitative material. Simply Wall St has no position in any stocks mentioned.
New: Manage All Your Stock Portfolios in One Place
We've created the ultimate portfolio companion for stock investors, and it's free.
• Connect an unlimited number of Portfolios and see your total in one currency
• Be alerted to new Warning Signs or Risks via email or mobile
• Track the Fair Value of your stocks
Have feedback on this article? Concerned about the content? Get in touch with us directly. Alternatively, email editorial-team@simplywallst.com
About NYSE:AFG
American Financial Group
An insurance holding company, provides specialty property and casualty insurance products in the United States.
Excellent balance sheet average dividend payer.
Similar Companies
Market Insights

Advertisement
Community Narratives
The "Molecular Pencil": Why Beam's Technology is Built to Win
Fair Value US$65.01|65.4% undervalued
DA
Community Contributor
The silent giant behind virtually every advanced chip powering AI, smartphones, and modern infrastructure.
Fair Value US$310.00|6.1% undervalued
OS
Community Contributor
ADP Stock: Solid Fundamentals, But AI Investments Test Its Margin Resilience
Fair Value US$387.77|34.2% undervalued
YI
Community Contributor
MINISO's fair value is projected at 26.69 with an anticipated PE ratio shift of 20x
Fair Value US$24.03|9.6% undervalued
BE
Community Contributor