Advertisement
- United States
- /
- Household Products
- /
- NasdaqGS:REYN
Is There Value in Reynolds Consumer Products After a 7.7% Drop in 2025?

Simply Wall St
Reviewed by Bailey Pemberton
- Curious about whether Reynolds Consumer Products could be the value pick you've been searching for, or if there are red flags hiding beneath the surface?
- The stock price has seen only minor shifts lately, slipping 0.8% over the past week and remaining almost flat over the last month. However, it is still down 7.7% so far this year.
- Recent headlines show that industry trends and shifting consumer habits are in focus, with analysts watching closely as grocers adjust shelf space for household disposable products. These developments provide important context for the company’s recent price movement and are worth noting as we evaluate where the stock stands.
- When it comes to valuation, Reynolds Consumer Products scores a respectable 4 out of 6 on our value checks. This indicates several positive signs but also a few areas to watch. We will break down what goes into this score using standard approaches, and invite you to stay with us to consider additional perspectives on whether this stock is truly undervalued.
Approach 1: Reynolds Consumer Products Discounted Cash Flow (DCF) Analysis
The Discounted Cash Flow (DCF) model estimates a company's intrinsic value by projecting its future cash flows and then discounting them back to today’s dollars. This approach helps investors gauge whether a stock is trading below or above its real worth.
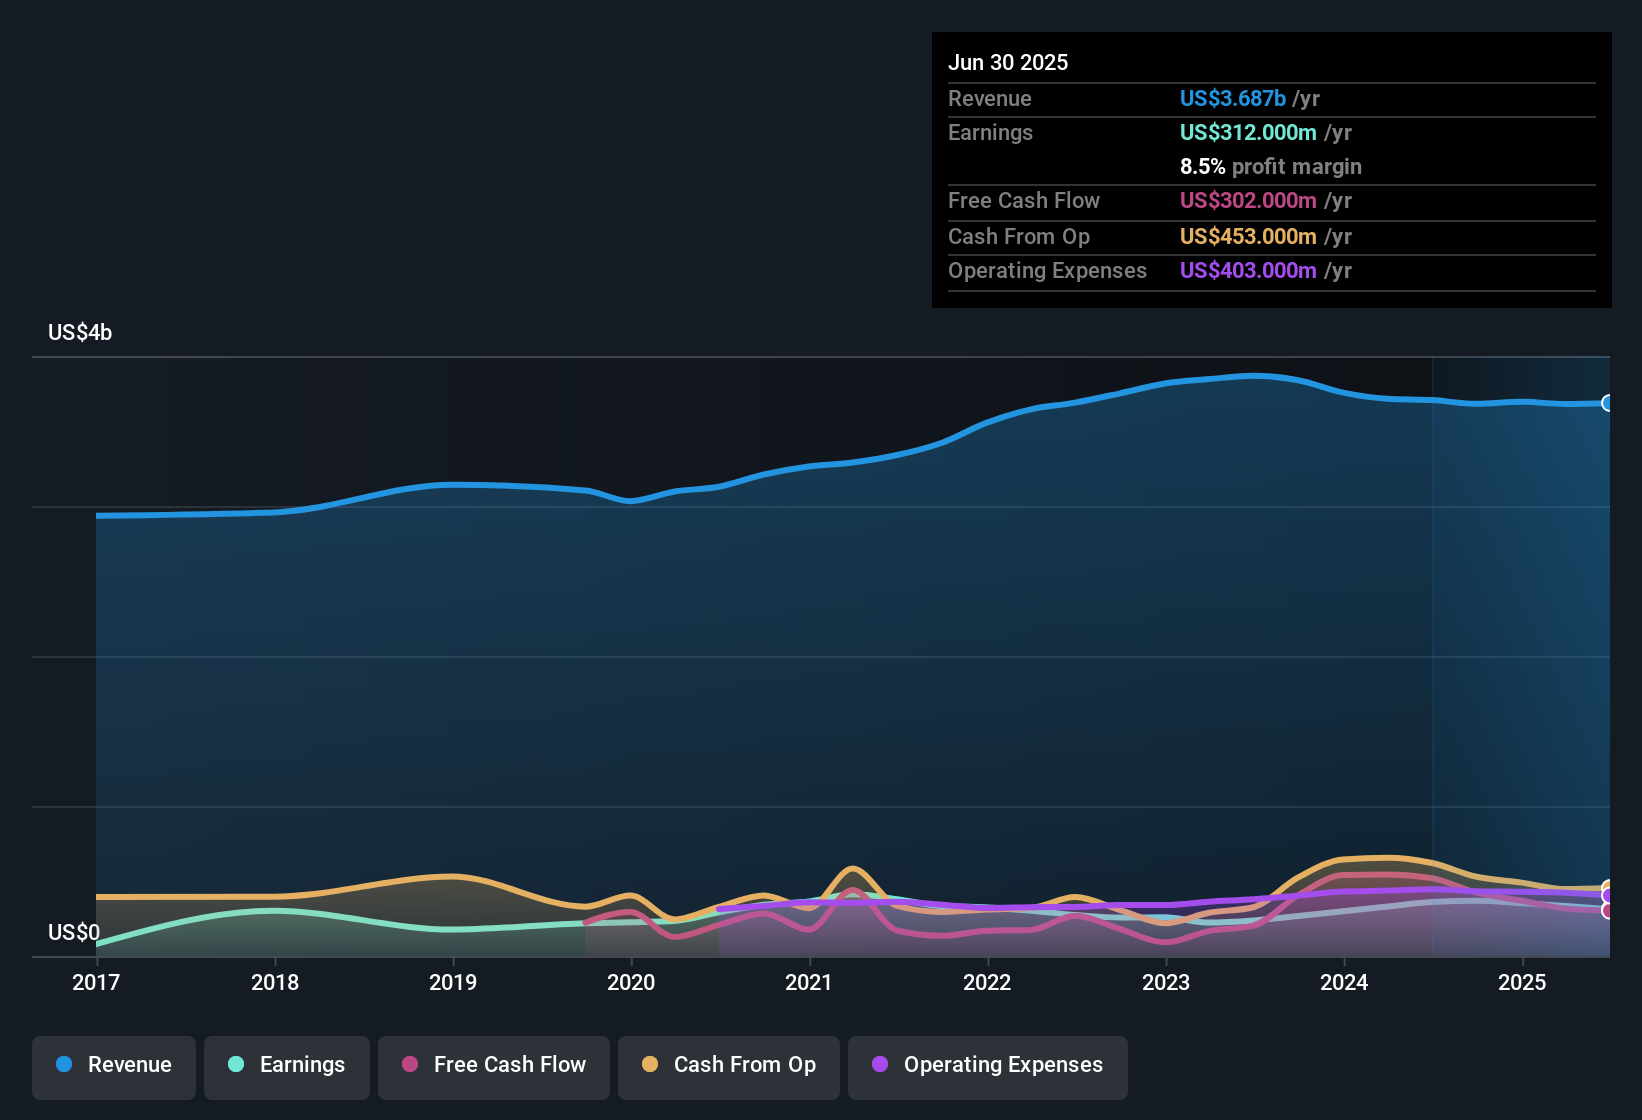
For Reynolds Consumer Products, the latest reported Free Cash Flow stands at $293 million. Looking ahead, analysts predict solid growth, with Free Cash Flow expected to reach approximately $435 million by 2029. While forecasts are most reliable for the next five years, projections beyond this period are extrapolated using industry growth assumptions. All figures are presented in US dollars.
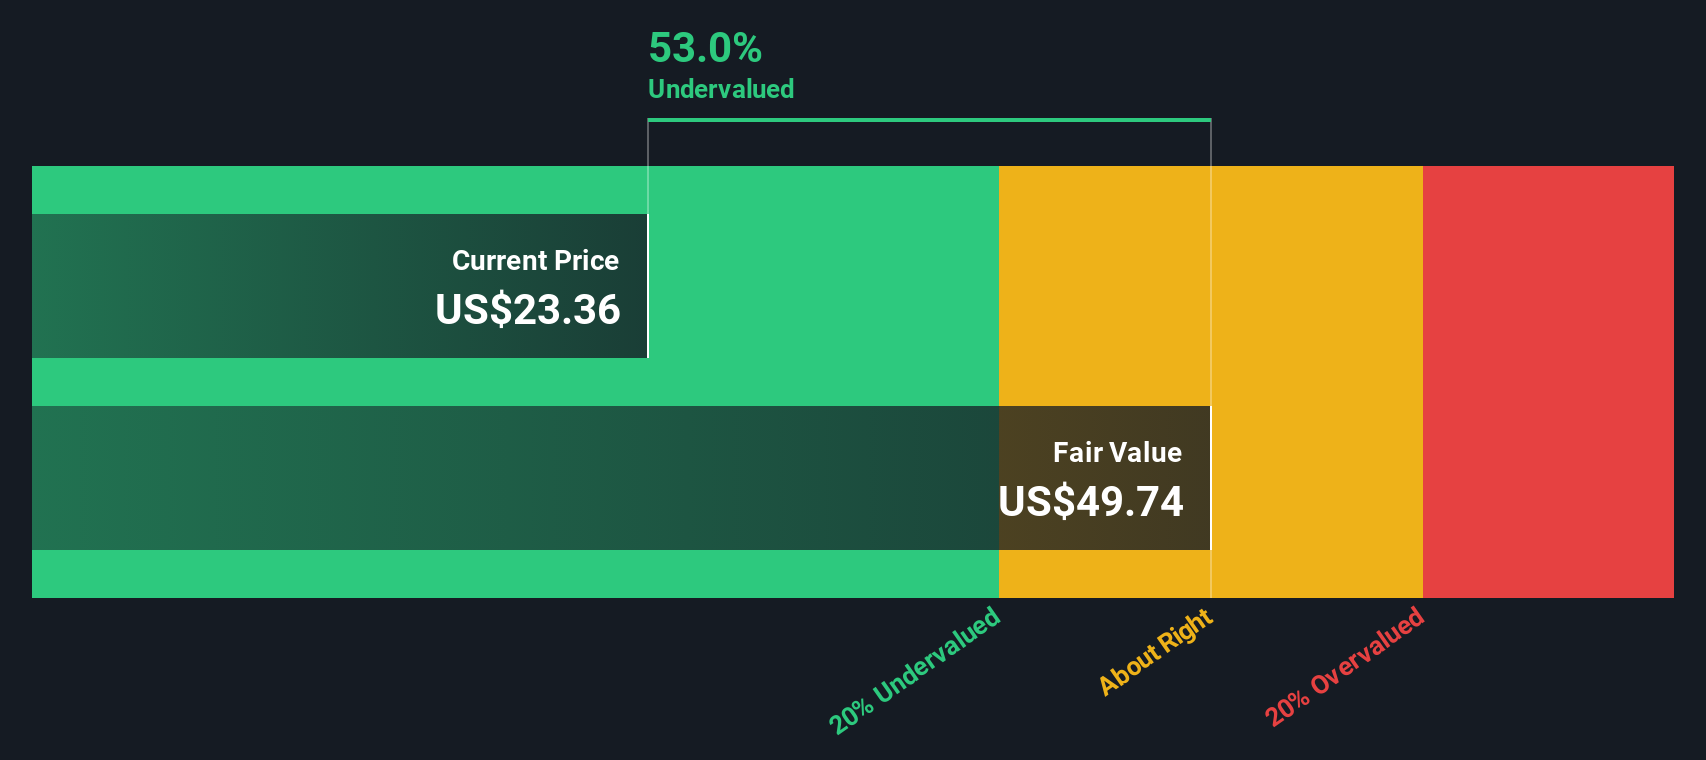
Based on these projections, the DCF model calculates an intrinsic value of $51.55 per share. Compared to the current share price, this represents an estimated discount of 52.0%. In simple terms, the stock appears to be significantly undervalued by the market according to this cash flow-based model.
Result: UNDERVALUED
Our Discounted Cash Flow (DCF) analysis suggests Reynolds Consumer Products is undervalued by 52.0%. Track this in your watchlist or portfolio, or discover 836 more undervalued stocks based on cash flows.
Approach 2: Reynolds Consumer Products Price vs Earnings
For companies like Reynolds Consumer Products that are consistently profitable, the Price-to-Earnings (PE) ratio is a reliable valuation tool. The PE ratio helps investors assess whether a stock’s price fairly reflects its current earnings power, factoring in market sentiment about future growth and associated risks.
A “normal” or “fair” PE ratio for any stock depends on market expectations for growth and the risks unique to the business. Generally, higher expected earnings growth or lower risk profiles justify a higher PE, while lower growth or greater uncertainty push this number down.
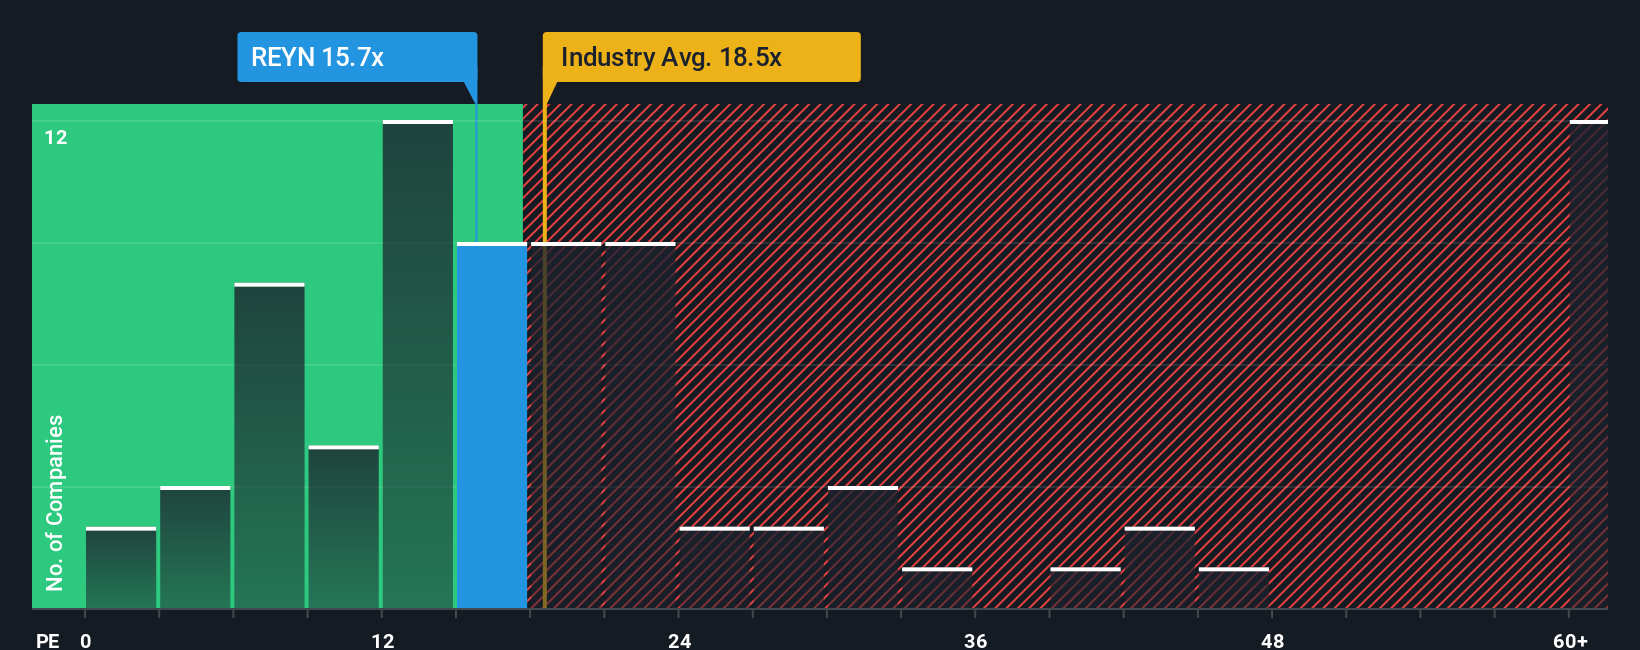
Currently, Reynolds Consumer Products trades at a 17.07x PE ratio. This is just above its peer group average of 16.77x, and only slightly below the Household Products industry average of 17.78x. These comparisons suggest the market broadly views Reynolds in line with similar companies.
However, Simply Wall St's proprietary “Fair Ratio” offers a more comprehensive benchmark. It calculates what the PE ratio should be for Reynolds based on important factors beyond just simple peer benchmarking, such as the company’s earnings growth rate, profit margins, market capitalization, and its specific industry risks. In this case, Reynolds’ Fair PE ratio comes out at 18.24x.
Comparing the current PE of 17.07x to the Fair Ratio of 18.24x, there is only a small difference between the two, indicating the stock is valued about right according to this more tailored assessment.
Result: ABOUT RIGHT
PE ratios tell one story, but what if the real opportunity lies elsewhere? Discover 1406 companies where insiders are betting big on explosive growth.
Upgrade Your Decision Making: Choose your Reynolds Consumer Products Narrative
Earlier we mentioned that there is an even better way to understand valuation, so let's introduce you to Narratives. A Narrative is your personal investment story backed by your own forecasts and assumptions, linking how you see a company’s future (like revenue and margin estimates) directly to what you believe its fair value should be.
Instead of relying purely on traditional models, Narratives on Simply Wall St’s Community page make it simple for investors to align their view of a business with a dynamic valuation. Whether you’re optimistic due to a new product launch or cautious because of industry challenges, you can build your own scenario. As news or earnings come out, Narratives update automatically to reflect the latest data, keeping your view current without manual work.
This approach empowers you to decide whether Reynolds Consumer Products is a good buy or sell by comparing your fair value against the latest share price, making your investment decisions both easier and more customized.
For example, two investors may have very different Narratives. One might believe that strong innovation and operational efficiency justify a $30.00 price target, while another, wary of rising costs and shifting demand, sees fair value closer to $22.00. Narratives let you capture your own outlook just as easily.
Do you think there's more to the story for Reynolds Consumer Products? Head over to our Community to see what others are saying!
This article by Simply Wall St is general in nature. We provide commentary based on historical data and analyst forecasts only using an unbiased methodology and our articles are not intended to be financial advice. It does not constitute a recommendation to buy or sell any stock, and does not take account of your objectives, or your financial situation. We aim to bring you long-term focused analysis driven by fundamental data. Note that our analysis may not factor in the latest price-sensitive company announcements or qualitative material. Simply Wall St has no position in any stocks mentioned.
New: AI Stock Screener & Alerts
Our new AI Stock Screener scans the market every day to uncover opportunities.
• Dividend Powerhouses (3%+ Yield)
• Undervalued Small Caps with Insider Buying
• High growth Tech and AI Companies
Or build your own from over 50 metrics.
Have feedback on this article? Concerned about the content? Get in touch with us directly. Alternatively, email editorial-team@simplywallst.com
About NasdaqGS:REYN
Reynolds Consumer Products
Produces and sells products in cooking, waste and storage, and tableware product categories in the United States and internationally.
Good value with adequate balance sheet.
Similar Companies
Market Insights

Advertisement
Community Narratives
The company that turned a verb into a global necessity and basically runs the modern internet, digital ads, smartphones, maps, and AI.
Fair Value US$300.00|5.2% undervalued
OS
Community Contributor
Flowers Foods Pays A Fair Price For Health
Fair Value US$16.12|24.9% undervalued
NV
Community Contributor
TMX Group will thrive with 33.3% profit margin and enduring market moat
Fair Value CA$49.90|3.3% overvalued
LI
Community Contributor
The "Molecular Pencil": Why Beam's Technology is Built to Win
Fair Value US$65.01|64.5% undervalued
DA
Community Contributor