- United States
- /
- Oil and Gas
- /
- NYSE:OXY
Occidental Petroleum (NYSE:OXY) delivers shareholders enviable 88% CAGR over 3 years, surging 5.1% in the last week alone


Investing can be hard but the potential fo an individual stock to pay off big time inspires us. Mistakes are inevitable, but a single top stock pick can cover any losses, and so much more. One bright shining star stock has been Occidental Petroleum Corporation (NYSE:OXY), which is 553% higher than three years ago. In the last week the share price is up 5.1%. It really delights us to see such great share price performance for investors.
The past week has proven to be lucrative for Occidental Petroleum investors, so let's see if fundamentals drove the company's three-year performance.
Check out our latest analysis for Occidental Petroleum
To paraphrase Benjamin Graham: Over the short term the market is a voting machine, but over the long term it's a weighing machine. One imperfect but simple way to consider how the market perception of a company has shifted is to compare the change in the earnings per share (EPS) with the share price movement.
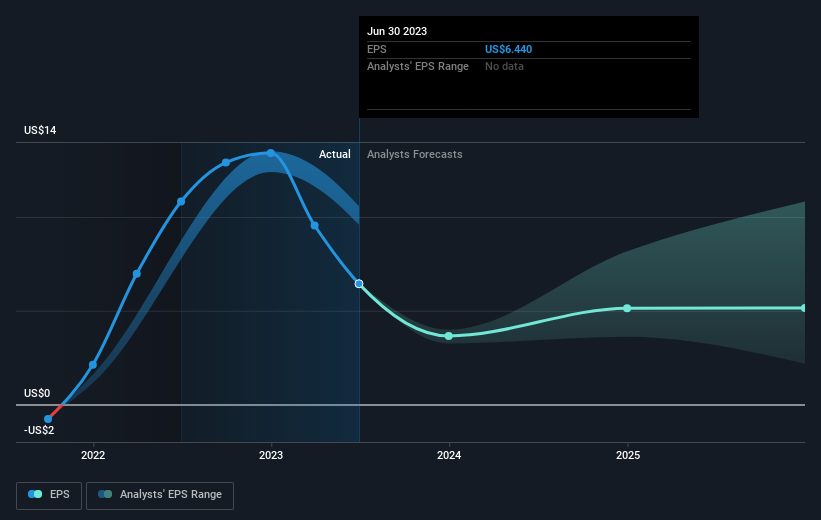
Occidental Petroleum became profitable within the last three years. That kind of transition can be an inflection point that justifies a strong share price gain, just as we have seen here.
You can see how EPS has changed over time in the image below (click on the chart to see the exact values).
It is of course excellent to see how Occidental Petroleum has grown profits over the years, but the future is more important for shareholders. Take a more thorough look at Occidental Petroleum's financial health with this free report on its balance sheet.
What About Dividends?
When looking at investment returns, it is important to consider the difference between total shareholder return (TSR) and share price return. The TSR incorporates the value of any spin-offs or discounted capital raisings, along with any dividends, based on the assumption that the dividends are reinvested. So for companies that pay a generous dividend, the TSR is often a lot higher than the share price return. In the case of Occidental Petroleum, it has a TSR of 566% for the last 3 years. That exceeds its share price return that we previously mentioned. And there's no prize for guessing that the dividend payments largely explain the divergence!
A Different Perspective
While the broader market gained around 16% in the last year, Occidental Petroleum shareholders lost 2.4% (even including dividends). However, keep in mind that even the best stocks will sometimes underperform the market over a twelve month period. On the bright side, long term shareholders have made money, with a gain of 2% per year over half a decade. If the fundamental data continues to indicate long term sustainable growth, the current sell-off could be an opportunity worth considering. While it is well worth considering the different impacts that market conditions can have on the share price, there are other factors that are even more important. To that end, you should learn about the 3 warning signs we've spotted with Occidental Petroleum (including 1 which can't be ignored) .
Of course, you might find a fantastic investment by looking elsewhere. So take a peek at this free list of companies we expect will grow earnings.
Please note, the market returns quoted in this article reflect the market weighted average returns of stocks that currently trade on American exchanges.
New: AI Stock Screener & Alerts
Our new AI Stock Screener scans the market every day to uncover opportunities.
• Dividend Powerhouses (3%+ Yield)
• Undervalued Small Caps with Insider Buying
• High growth Tech and AI Companies
Or build your own from over 50 metrics.
Have feedback on this article? Concerned about the content? Get in touch with us directly. Alternatively, email editorial-team (at) simplywallst.com.
This article by Simply Wall St is general in nature. We provide commentary based on historical data and analyst forecasts only using an unbiased methodology and our articles are not intended to be financial advice. It does not constitute a recommendation to buy or sell any stock, and does not take account of your objectives, or your financial situation. We aim to bring you long-term focused analysis driven by fundamental data. Note that our analysis may not factor in the latest price-sensitive company announcements or qualitative material. Simply Wall St has no position in any stocks mentioned.
About NYSE:OXY
Occidental Petroleum
Engages in the acquisition, exploration, and development of oil and gas properties in the United States, the Middle East, and North Africa.
Undervalued with mediocre balance sheet.
