- United States
- /
- Oil and Gas
- /
- NYSE:BTU
The 10% return this week takes Peabody Energy's (NYSE:BTU) shareholders three-year gains to 93%


By buying an index fund, investors can approximate the average market return. But if you buy good businesses at attractive prices, your portfolio returns could exceed the average market return. Just take a look at Peabody Energy Corporation (NYSE:BTU), which is up 89%, over three years, soundly beating the market return of 19% (not including dividends). On the other hand, the returns haven't been quite so good recently, with shareholders up just 3.2%, including dividends.
The past week has proven to be lucrative for Peabody Energy investors, so let's see if fundamentals drove the company's three-year performance.
See our latest analysis for Peabody Energy
To quote Buffett, 'Ships will sail around the world but the Flat Earth Society will flourish. There will continue to be wide discrepancies between price and value in the marketplace...' One flawed but reasonable way to assess how sentiment around a company has changed is to compare the earnings per share (EPS) with the share price.
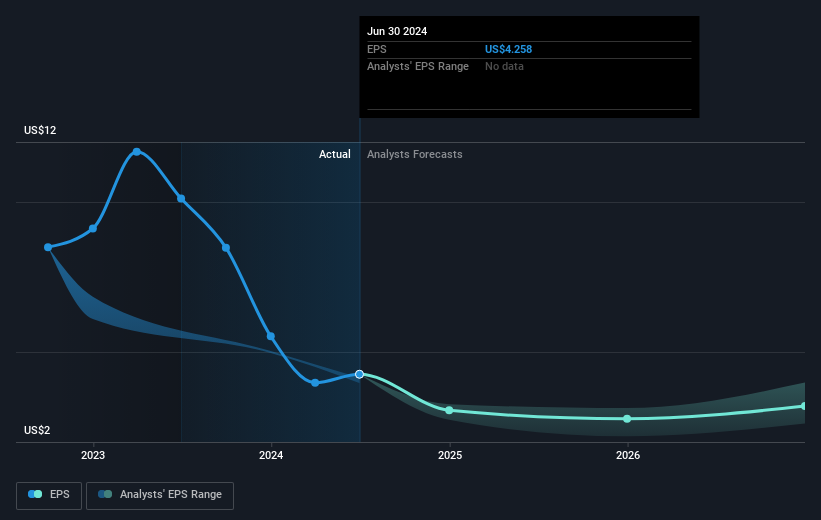
During three years of share price growth, Peabody Energy moved from a loss to profitability. That would generally be considered a positive, so we'd expect the share price to be up.
You can see how EPS has changed over time in the image below (click on the chart to see the exact values).
We know that Peabody Energy has improved its bottom line over the last three years, but what does the future have in store? If you are thinking of buying or selling Peabody Energy stock, you should check out this FREE detailed report on its balance sheet.
What About Dividends?
When looking at investment returns, it is important to consider the difference between total shareholder return (TSR) and share price return. Whereas the share price return only reflects the change in the share price, the TSR includes the value of dividends (assuming they were reinvested) and the benefit of any discounted capital raising or spin-off. Arguably, the TSR gives a more comprehensive picture of the return generated by a stock. In the case of Peabody Energy, it has a TSR of 93% for the last 3 years. That exceeds its share price return that we previously mentioned. This is largely a result of its dividend payments!
A Different Perspective
Peabody Energy provided a TSR of 3.2% over the last twelve months. But that return falls short of the market. If we look back over five years, the returns are even better, coming in at 12% per year for five years. It's quite possible the business continues to execute with prowess, even as the share price gains are slowing. While it is well worth considering the different impacts that market conditions can have on the share price, there are other factors that are even more important. Even so, be aware that Peabody Energy is showing 2 warning signs in our investment analysis , and 1 of those is concerning...
If you like to buy stocks alongside management, then you might just love this free list of companies. (Hint: many of them are unnoticed AND have attractive valuation).
Please note, the market returns quoted in this article reflect the market weighted average returns of stocks that currently trade on American exchanges.
New: Manage All Your Stock Portfolios in One Place
We've created the ultimate portfolio companion for stock investors, and it's free.
• Connect an unlimited number of Portfolios and see your total in one currency
• Be alerted to new Warning Signs or Risks via email or mobile
• Track the Fair Value of your stocks
Have feedback on this article? Concerned about the content? Get in touch with us directly. Alternatively, email editorial-team (at) simplywallst.com.
This article by Simply Wall St is general in nature. We provide commentary based on historical data and analyst forecasts only using an unbiased methodology and our articles are not intended to be financial advice. It does not constitute a recommendation to buy or sell any stock, and does not take account of your objectives, or your financial situation. We aim to bring you long-term focused analysis driven by fundamental data. Note that our analysis may not factor in the latest price-sensitive company announcements or qualitative material. Simply Wall St has no position in any stocks mentioned.
About NYSE:BTU
Peabody Energy
Engages in coal mining business in the United States, Japan, Taiwan, Australia, India, Brazil, Belgium, Chile, France, Indonesia, China, Vietnam, South Korea, Germany, and internationally.
Flawless balance sheet and undervalued.

