Advertisement
- United States
- /
- Diversified Financial
- /
- NasdaqGS:FISV
Does Fiserv’s 49% Stock Slide Signal a Fresh Value Opportunity?

Simply Wall St
Reviewed by Bailey Pemberton
- Wondering if Fiserv is trading at a bargain price or if the market already sees its true potential? Let’s dig in and see where the value story stands.
- Fiserv’s stock price has seen a dramatic decline recently, dropping nearly 49% over the past month and over 68% year-to-date. This is raising eyebrows about both risk and opportunity.
- These sharp moves have followed headlines about regulatory shifts impacting the fintech industry and changes in market sentiment toward digital payment platforms. Several analysts have pointed to sector-wide volatility and evolving competition as key ingredients behind recent price action.
- Despite the turbulence, Fiserv scores a solid 5 out of 6 on our valuation checks. This suggests there is a lot to unpack in its underlying value. We’ll walk through the usual valuation approaches next, and at the end, reveal a smarter way to get the full picture.
Find out why Fiserv's -68.3% return over the last year is lagging behind its peers.
Approach 1: Fiserv Excess Returns Analysis
The Excess Returns model evaluates a company by measuring how much profit it generates above the required rate of return on its equity. In simple terms, this approach asks whether Fiserv creates more value for shareholders than what could be expected from a typical investment with similar risk, and by how much.
For Fiserv, key data points highlight its underlying profitability and reinvestment potential. Book value per share stands at $46.78, while stable earnings per share (EPS) are forecast at $10.51, based on weighted future Return on Equity estimates from eight analysts. The company benefits from a healthy average Return on Equity of 19.73%, much higher than many industry peers. With a cost of equity of $4.75 per share, Fiserv earns an excess return of $5.77 per share, reflecting its impressive ability to generate surplus profit over its cost of capital. Stable book value estimates are $53.28 per share, according to input from four analysts.
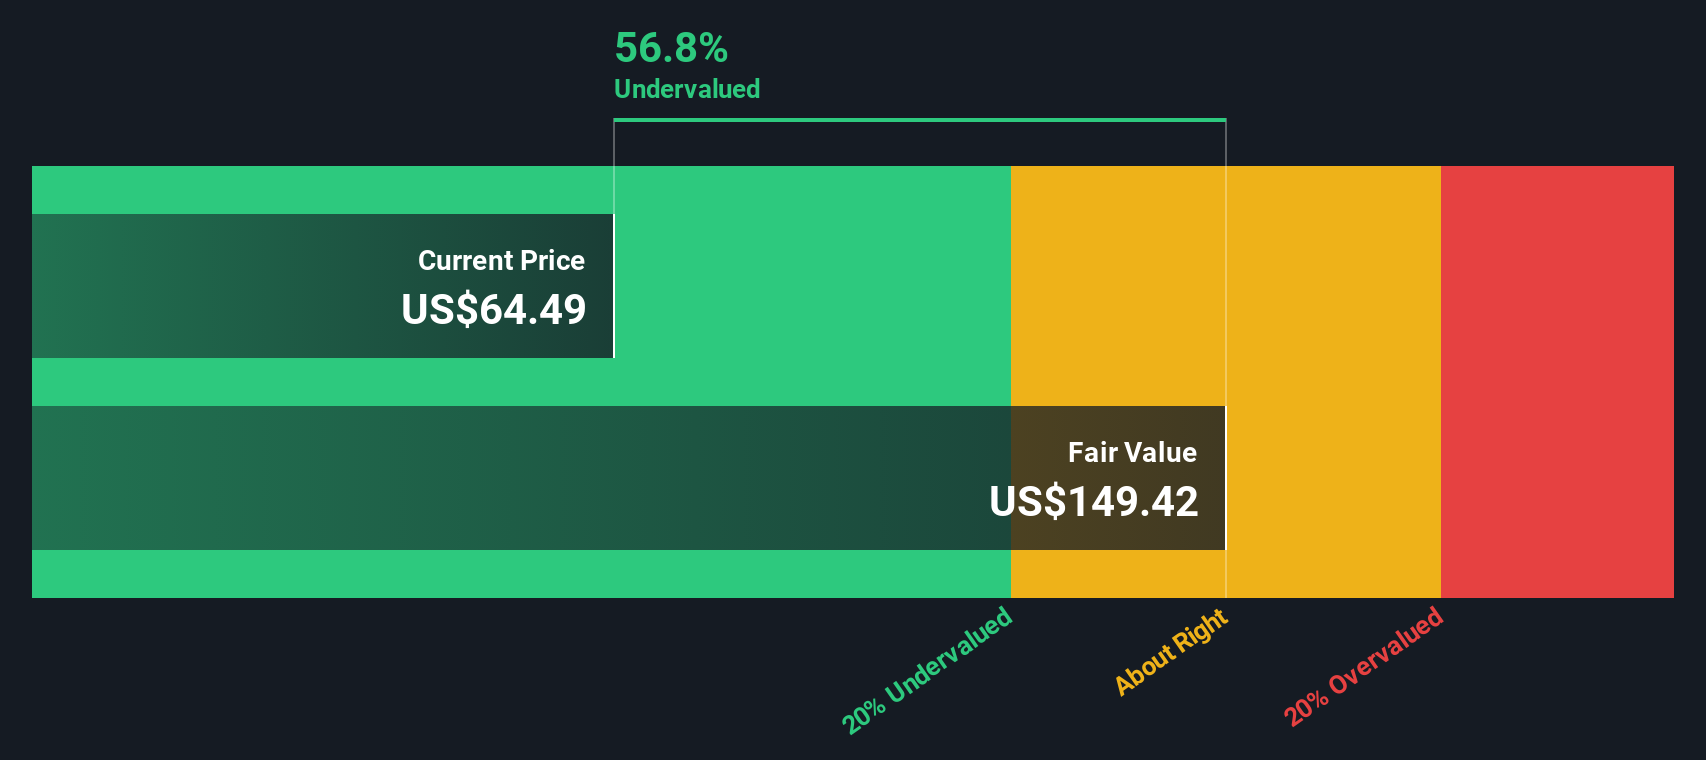
Based on these projections, the Excess Returns model points to an intrinsic value of $152.16 per share. This indicates the stock is about 57.6% undervalued compared to its current price. This sizable discount suggests that the market may be overlooking Fiserv's consistent profitability and capital efficiency.
Result: UNDERVALUED
Our Excess Returns analysis suggests Fiserv is undervalued by 57.6%. Track this in your watchlist or portfolio, or discover 840 more undervalued stocks based on cash flows.
Approach 2: Fiserv Price vs Earnings
The Price-to-Earnings (PE) ratio is often the go-to measure for valuing profitable companies like Fiserv. Since the PE ratio compares a company's share price with its earnings per share, it provides a direct sense of how much investors are willing to pay for each dollar of profit.
A "fair" PE ratio depends on several factors, such as expected earnings growth and the risks facing the business. Companies with higher growth or lower risk usually justify a higher PE, while businesses with stagnant earnings or greater uncertainty tend to trade at lower multiples.
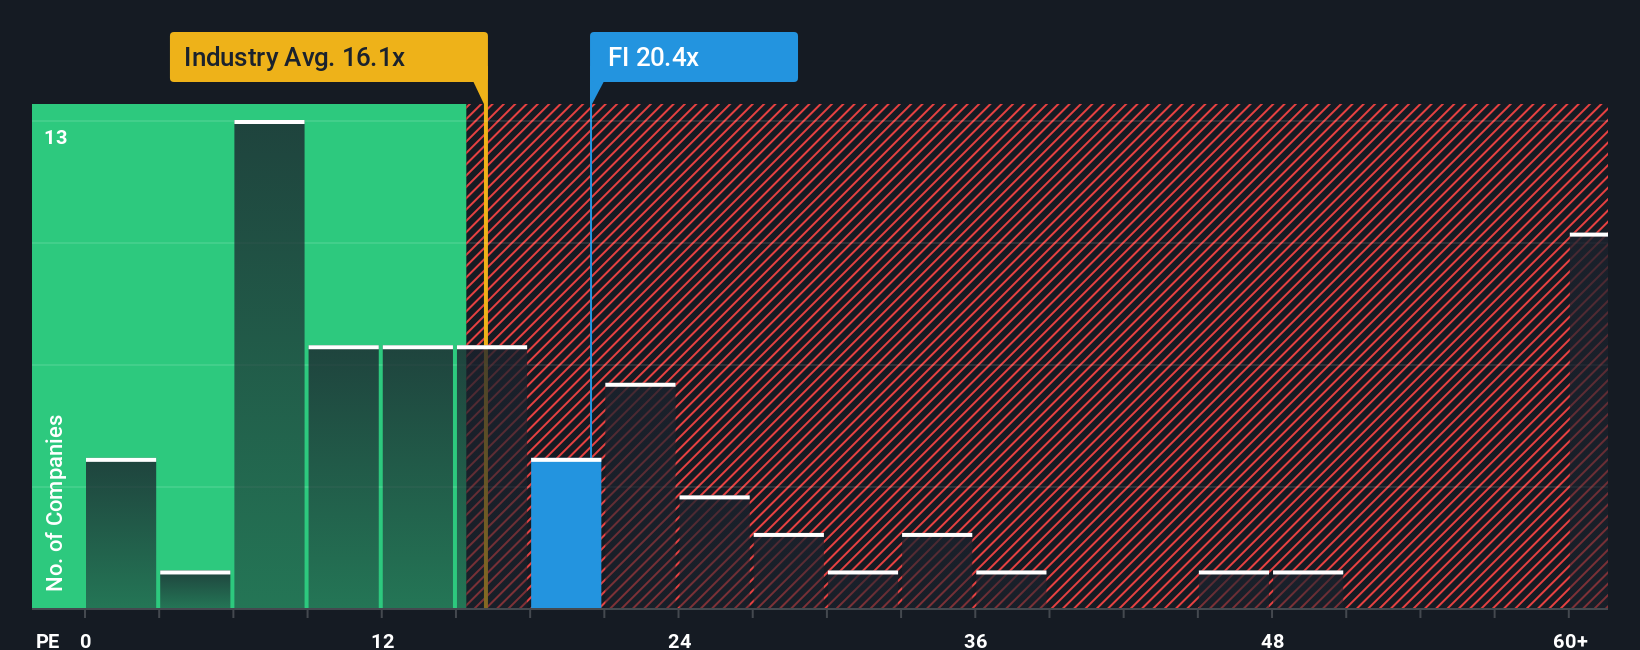
Fiserv currently trades at a PE of 9.61x. This is noticeably below the Diversified Financial industry average of 14.96x and the peer average of 14.24x. On its face, this discount signals the market may be cautious on Fiserv relative to its sector.
To dig deeper, Simply Wall St uses a Fair Ratio for Fiserv of 19.45x. This estimate factors in the company’s growth outlook, profit margins, risks, market cap, and its position within the industry. This tailored approach provides a more reliable benchmark than a straight peer or industry comparison, since companies of different sizes or risk profiles rarely deserve the same multiples.
With Fiserv’s current PE at 9.61x and a Fair Ratio of 19.45x, the shares appear meaningfully undervalued on this measure. The sizable gap suggests that the market may not be fully recognizing Fiserv’s potential relative to its fair value based on fundamentals.
Result: UNDERVALUED
PE ratios tell one story, but what if the real opportunity lies elsewhere? Discover 1409 companies where insiders are betting big on explosive growth.
Upgrade Your Decision Making: Choose your Fiserv Narrative
Earlier we mentioned there is an even better way to approach valuation, so let’s introduce you to Narratives. A Narrative is your unique, evidence-based story about a company, linking your understanding of its trends, strengths, and risks with your own forecasts for revenue, earnings, and profit margins, which together shape your view of what the business is worth.
Narratives go beyond just the numbers by connecting Fiserv’s strategic moves and long-term potential directly to a fair value estimate. This tool makes it easy for anyone, no matter their experience level, to build, update, and share their perspective within the Simply Wall St Community, a platform trusted by millions of investors.
By creating a Narrative, you can clearly see how your forecasted fair value compares to today's price, helping you decide when to buy or sell based on your personal convictions, not just market sentiment. What’s more, Narratives automatically update when new information emerges, so your analysis stays relevant if there is a major news announcement or an earnings release.
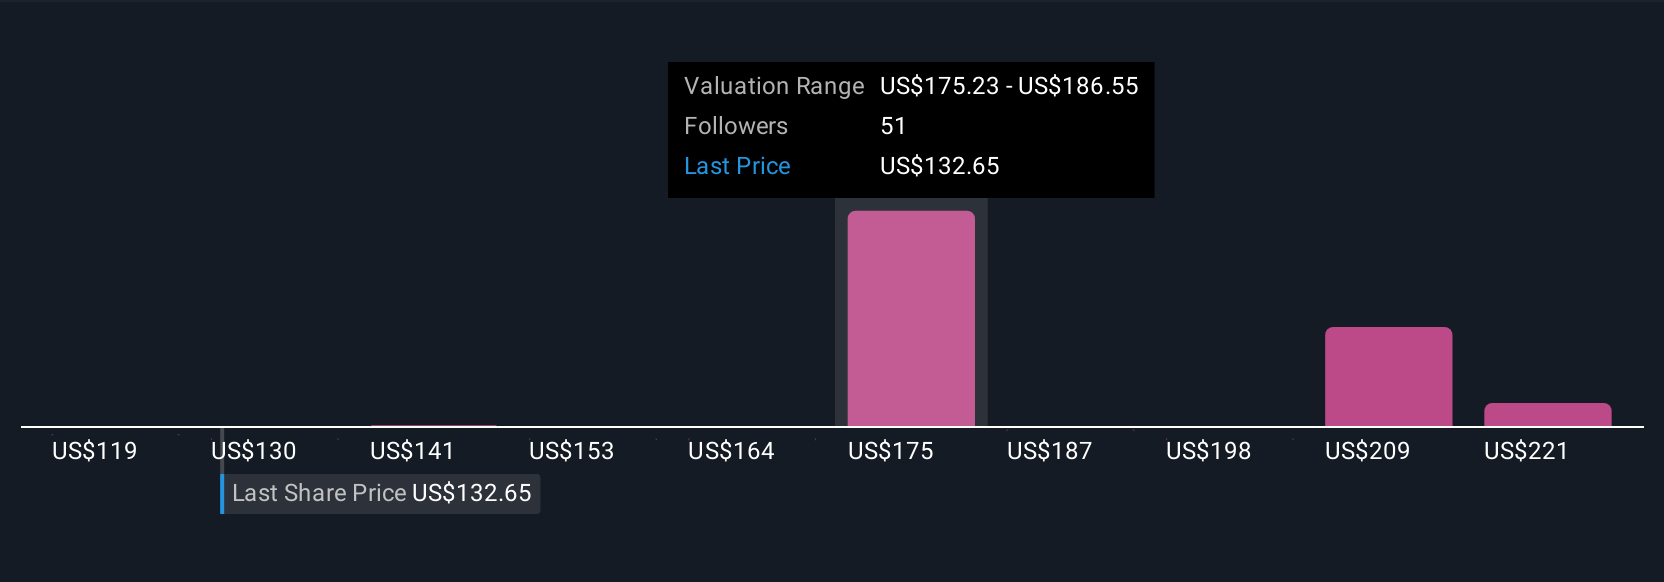
For example, while some investors might focus on Fiserv’s international expansion and see upside to the $250 analyst target, others worry about execution delays or margin pressure and forecast fair values as low as $125, all using Narratives as their guide.
Do you think there's more to the story for Fiserv? Head over to our Community to see what others are saying!
This article by Simply Wall St is general in nature. We provide commentary based on historical data and analyst forecasts only using an unbiased methodology and our articles are not intended to be financial advice. It does not constitute a recommendation to buy or sell any stock, and does not take account of your objectives, or your financial situation. We aim to bring you long-term focused analysis driven by fundamental data. Note that our analysis may not factor in the latest price-sensitive company announcements or qualitative material. Simply Wall St has no position in any stocks mentioned.
New: AI Stock Screener & Alerts
Our new AI Stock Screener scans the market every day to uncover opportunities.
• Dividend Powerhouses (3%+ Yield)
• Undervalued Small Caps with Insider Buying
• High growth Tech and AI Companies
Or build your own from over 50 metrics.
Have feedback on this article? Concerned about the content? Get in touch with us directly. Alternatively, email editorial-team@simplywallst.com
About NasdaqGS:FISV
Fiserv
Provides payments and financial services technology solutions in the United States, Europe, the Middle East and Africa, Latin America, the Asia-Pacific, and internationally.
Undervalued with proven track record.
Similar Companies
Market Insights

Advertisement
Community Narratives
MINISO's fair value is projected at 26.69 with an anticipated PE ratio shift of 20x
Fair Value US$24.03|11.4% undervalued
BE
Community Contributor
Procter & Gamble: A Dividend Giant Facing Slowing Growth
Fair Value US$119.81|23.5% overvalued
AN
Community Contributor
Eli Lilly's Future Growth Driven by Tirzepatide and Favorable Market Conditions
Fair Value US$1.19k|14.0% undervalued
EA
Community Contributor