Advertisement
- United States
- /
- Diversified Financial
- /
- NYSE:BRK.A
Is Berkshire Hathaway Well Priced After Its 10% Gain and Recent Investment Headlines?

Simply Wall St
Reviewed by Bailey Pemberton
- Ever wondered if Berkshire Hathaway is still a smart buy, or if the price has already run away from value seekers? You are not alone. Today we are digging in to find out just how fairly or unfairly the stock is valued.
- After a solid 10.4% gain so far this year and an impressive 113.3% increase over five years, shares have certainly been on the move. This has shifted the conversation around both its growth prospects and perceived risk.
- Much of the recent momentum has been fueled by headlines ranging from Warren Buffett’s strategic investments in tech and energy to increasing cash reserves amid market uncertainty. Stories around Berkshire’s readiness for future opportunities and its continued discipline in capital allocation have kept it firmly in the spotlight.
- According to our checks, Berkshire scores 4 out of 6 on our valuation scale, showing strength but leaving room for debate on where its true value lies. Next up, we will break down how different valuation methods stack up, and later we will share the best way to make sense of it all.
Approach 1: Berkshire Hathaway Excess Returns Analysis
The Excess Returns model estimates a company’s value by examining how effectively it reinvests its profits above the basic cost of equity. This method reveals what surplus value is generated for shareholders over time. For Berkshire Hathaway, the analysis focuses on returns from past equity and future growth potential.
Currently, Berkshire Hathaway’s Book Value stands at $485,274.36 per share. Its Stable Earnings Per Share (EPS) is calculated at $66,154.88, based on the median Return on Equity from the past five years. The estimated Cost of Equity is $39,080.00 per share, which means Berkshire is expected to generate Excess Returns of $27,074.87 per share above what investors require. Its average Return on Equity is 12.85%, and projections indicate a Stable Book Value of $514,986.06 per share in the years ahead.
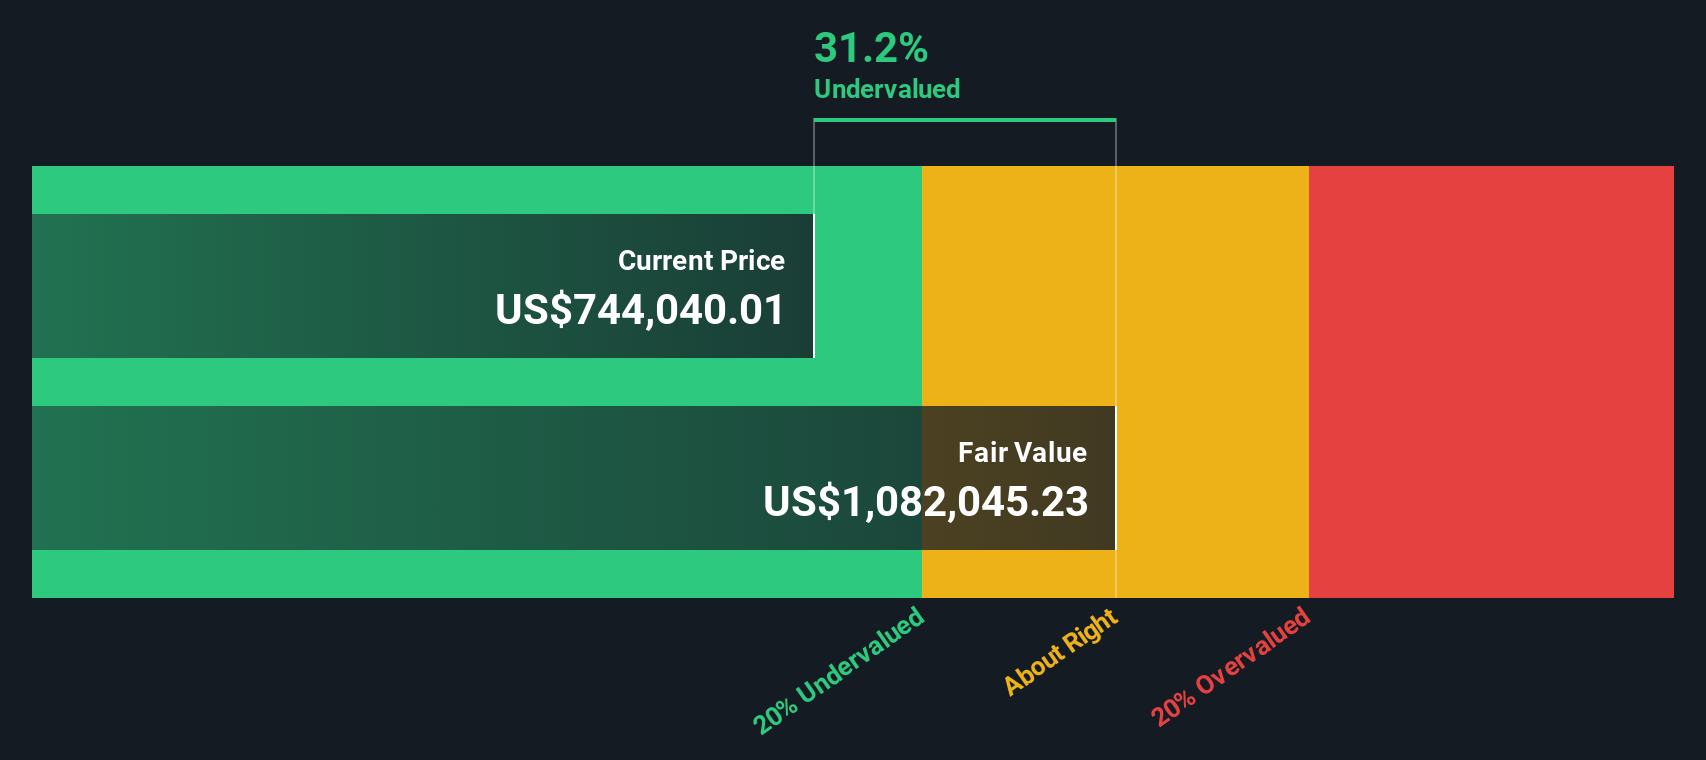
When these figures are input into the Excess Returns model, Berkshire Hathaway’s intrinsic value is estimated at $1,140,480 per share, with the current market price showing a 34.6% discount from this estimated fair value. In summary, the stock appears meaningfully undervalued for long-term investors focused on fundamentals.
Result: UNDERVALUED
Our Excess Returns analysis suggests Berkshire Hathaway is undervalued by 34.6%. Track this in your watchlist or portfolio, or discover 869 more undervalued stocks based on cash flows.
Approach 2: Berkshire Hathaway Price vs Earnings
The Price-to-Earnings (PE) ratio is a widely preferred valuation metric for profitable companies like Berkshire Hathaway. It provides investors with a clear sense of how much they are paying for each dollar of current earnings, making it a practical and intuitive tool for assessing value, especially in established businesses with steady profitability.
When setting expectations for what makes a “normal” or “fair” PE ratio, growth prospects and risk are key considerations. Companies expected to grow rapidly or with less risk typically command higher PE multiples, while slower growth or higher risk profiles lead to lower ratios. Context is crucial when comparing a company’s PE to others in the sector.
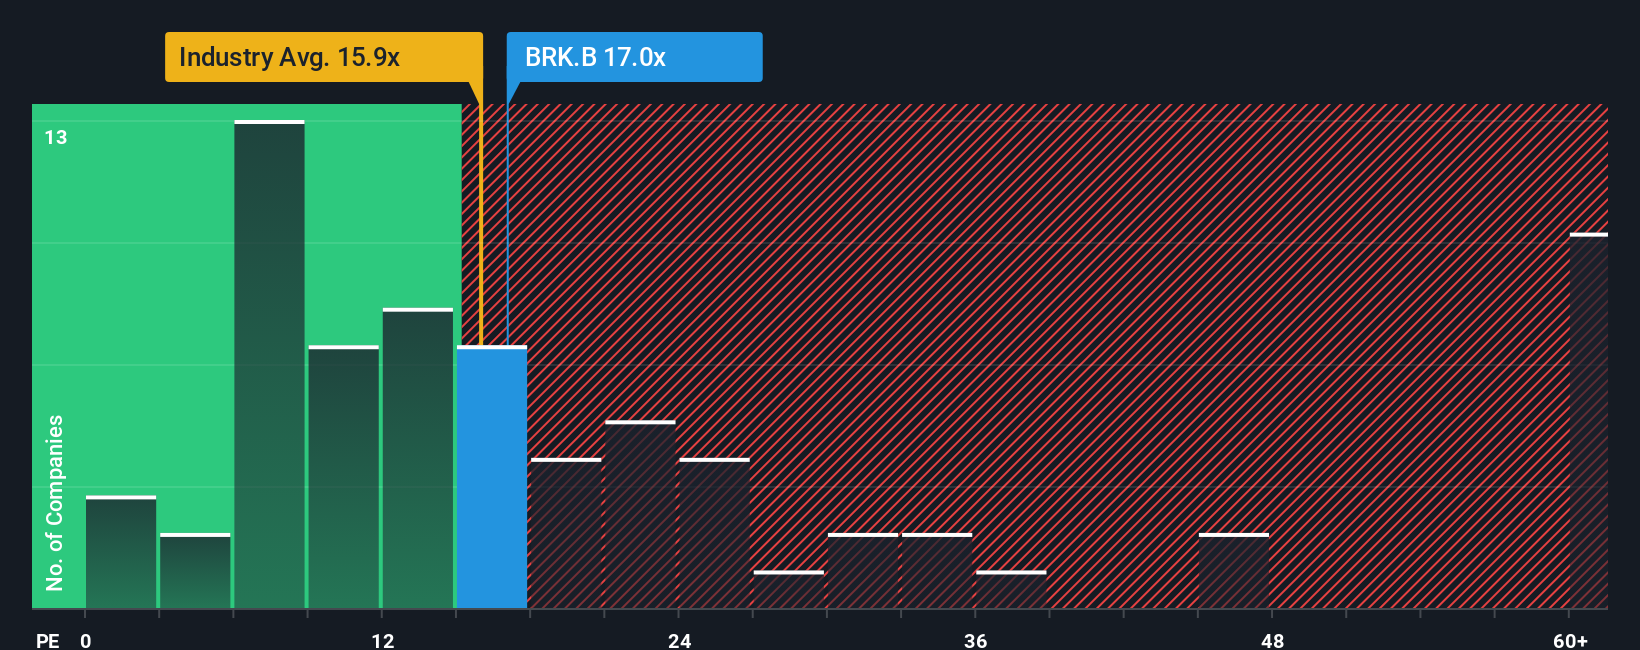
Berkshire Hathaway currently trades at a PE ratio of 15.90x, which is above the Diversified Financial industry average of 13.30x but well below its peer average of 27.12x. Simply Wall St’s proprietary “Fair Ratio” for Berkshire comes in at 16.92x. Unlike peer or industry comparisons alone, the Fair Ratio blends unique factors such as Berkshire’s earnings growth outlook, profit margins, market cap and risk profile. This makes it a more comprehensive gauge of true value and ensures the specific characteristics of the company are reflected in the analysis.
Comparing the current PE of 15.90x with the Fair Ratio of 16.92x, Berkshire Hathaway’s share price appears to be just about right, trading very close to its fair value on an earnings basis.
Result: ABOUT RIGHT
PE ratios tell one story, but what if the real opportunity lies elsewhere? Discover 1403 companies where insiders are betting big on explosive growth.
Upgrade Your Decision Making: Choose your Berkshire Hathaway Narrative
Earlier we mentioned that there is an even better way to understand valuation, so let’s introduce you to Narratives. A Narrative is the story behind your numbers. It lets investors combine their view of a company’s prospects with hard financial forecasts (like future revenue and margins) to arrive at their own fair value, bridging company fundamentals with a personal outlook. Narratives on Simply Wall St, available to millions on the Community page, make it easy and accessible to weigh up your perspective against others. They let you decide when to buy or sell by comparing your scenario’s Fair Value to the latest market Price. As fresh company news or earnings come in, your Narrative updates dynamically, ensuring your view stays relevant. For example, some Berkshire Hathaway Narratives see its value rising as management seeks new acquisitions, while others warn of slower growth after leadership succession. Even for the same stock, different investors will have very different fair values and strategies.
Do you think there's more to the story for Berkshire Hathaway? Head over to our Community to see what others are saying!
This article by Simply Wall St is general in nature. We provide commentary based on historical data and analyst forecasts only using an unbiased methodology and our articles are not intended to be financial advice. It does not constitute a recommendation to buy or sell any stock, and does not take account of your objectives, or your financial situation. We aim to bring you long-term focused analysis driven by fundamental data. Note that our analysis may not factor in the latest price-sensitive company announcements or qualitative material. Simply Wall St has no position in any stocks mentioned.
Valuation is complex, but we're here to simplify it.
Discover if Berkshire Hathaway might be undervalued or overvalued with our detailed analysis, featuring fair value estimates, potential risks, dividends, insider trades, and its financial condition.
Access Free AnalysisHave feedback on this article? Concerned about the content? Get in touch with us directly. Alternatively, email editorial-team@simplywallst.com
About NYSE:BRK.A
Berkshire Hathaway
Through its subsidiaries, engages in the insurance, freight rail transportation, and utility businesses.
Flawless balance sheet and good value.
Similar Companies
Market Insights

Advertisement
Community Narratives
The "Molecular Pencil": Why Beam's Technology is Built to Win
Fair Value US$65.01|65.4% undervalued
DA
Community Contributor
The silent giant behind virtually every advanced chip powering AI, smartphones, and modern infrastructure.
Fair Value US$310.00|6.1% undervalued
OS
Community Contributor
ADP Stock: Solid Fundamentals, But AI Investments Test Its Margin Resilience
Fair Value US$387.77|34.2% undervalued
YI
Community Contributor
MINISO's fair value is projected at 26.69 with an anticipated PE ratio shift of 20x
Fair Value US$24.03|9.6% undervalued
BE
Community Contributor