Advertisement
- United States
- /
- Diversified Financial
- /
- NYSE:APO
Analyzing Apollo After 12.4% Rally and Major Institutional Partnership News

Simply Wall St
Reviewed by Bailey Pemberton
- Wondering if Apollo Global Management is undervalued, overhyped, or hiding an opportunity? You are not alone; many investors are looking for clues about where the stock is headed next.
- Recently, the stock has shown a 1.8% gain over the last week and rallied 12.4% in the past month. However, it is still down 17.8% for the year, raising questions about shifting market perception and future potential.
- News about Apollo’s expanding assets under management and partnerships with major institutional investors has influenced recent share price movement, sparking optimism from some analysts. In addition, regulatory developments in the alternative investment space have played a role in shaping short-term sentiment toward the stock.
- Apollo scores a 3 out of 6 on our value checks so far. This means our standard valuation models offer mixed signals. Later in the article, we will look at how these tools compare and reveal an approach that may offer deeper insight.
Approach 1: Apollo Global Management Excess Returns Analysis
The Excess Returns valuation model assesses how effectively Apollo Global Management generates returns above its cost of equity. This approach focuses on return on invested capital, projected earnings per share, and future book value, rather than directly measuring cash flows.
For Apollo, here are the key metrics driving this model:
- Book Value: $37.46 per share
- Stable EPS: $12.55 per share
(Source: Weighted future Return on Equity estimates from 4 analysts.) - Cost of Equity: $5.12 per share
- Excess Return: $7.43 per share
- Average Return on Equity: 19.04%
- Stable Book Value: $65.92 per share
(Source: Weighted future Book Value estimates from 2 analysts.)
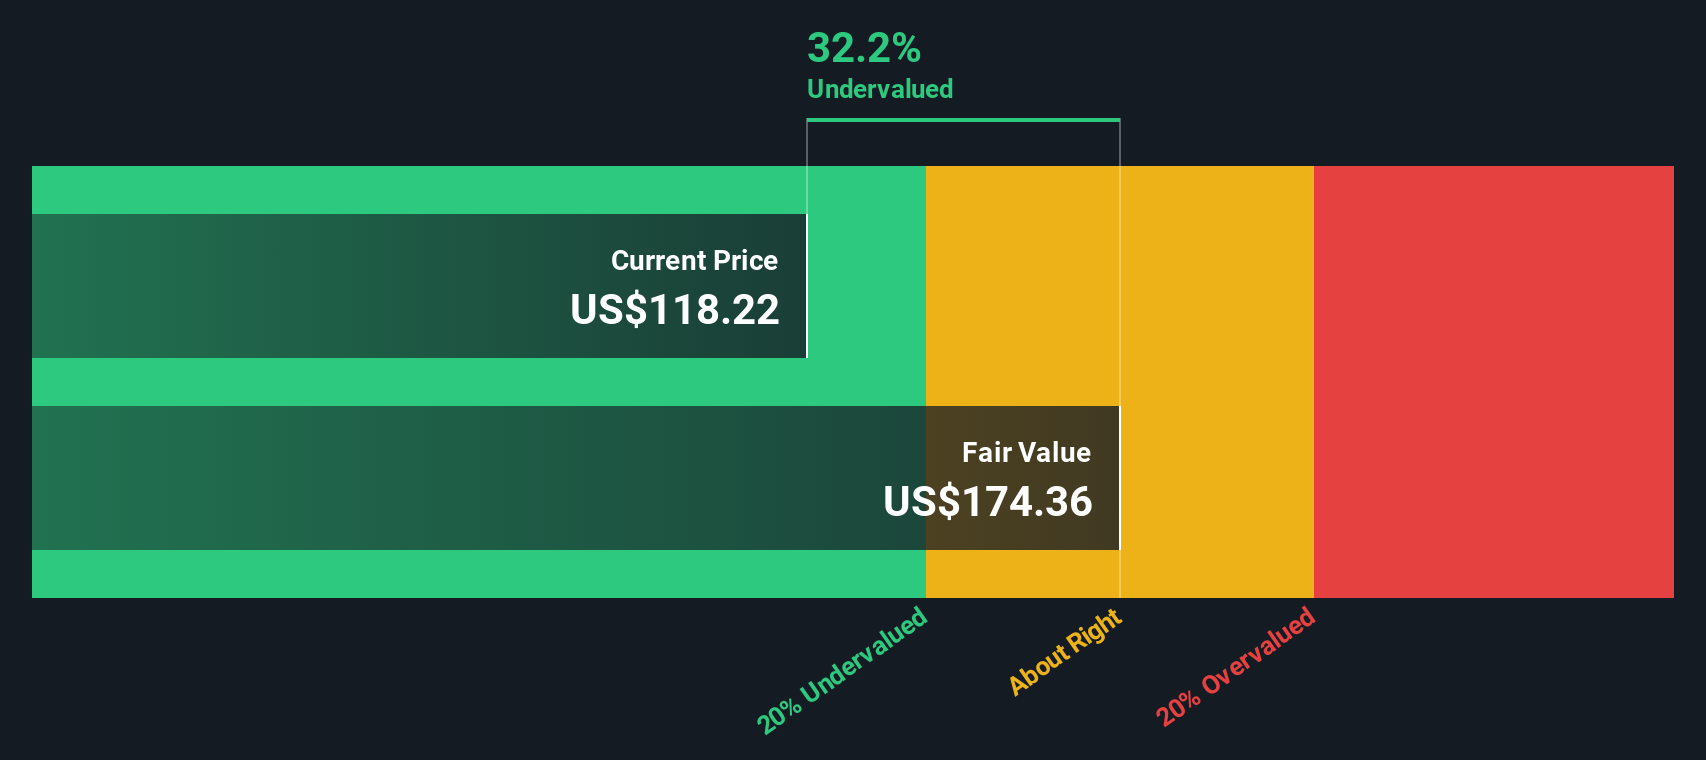
Based on this method, Apollo Global Management’s intrinsic value per share is estimated at $230.84. This implies that the stock is approximately 42.4% below its fair value when compared to current market prices, suggesting the stock is notably undervalued.
Result: UNDERVALUED
Our Excess Returns analysis suggests Apollo Global Management is undervalued by 42.4%. Track this in your watchlist or portfolio, or discover 872 more undervalued stocks based on cash flows.
Approach 2: Apollo Global Management Price vs Earnings
The Price-to-Earnings (PE) ratio is widely used to evaluate profitable companies because it compares the company’s share price to its earnings, helping investors gauge how much they are paying for each dollar of profit. It is especially relevant for firms with steady profits, like Apollo Global Management, as it reflects both current performance and some market expectations about the future.
What constitutes a "normal" or "fair" PE ratio depends on the company’s growth prospects and risk level. Companies expected to grow faster or with lower perceived risk often have higher PE ratios. Those with more uncertainty or slower growth usually trade at lower multiples. Essentially, the PE ratio provides a snapshot of investor expectations, adjusted for risk and growth.
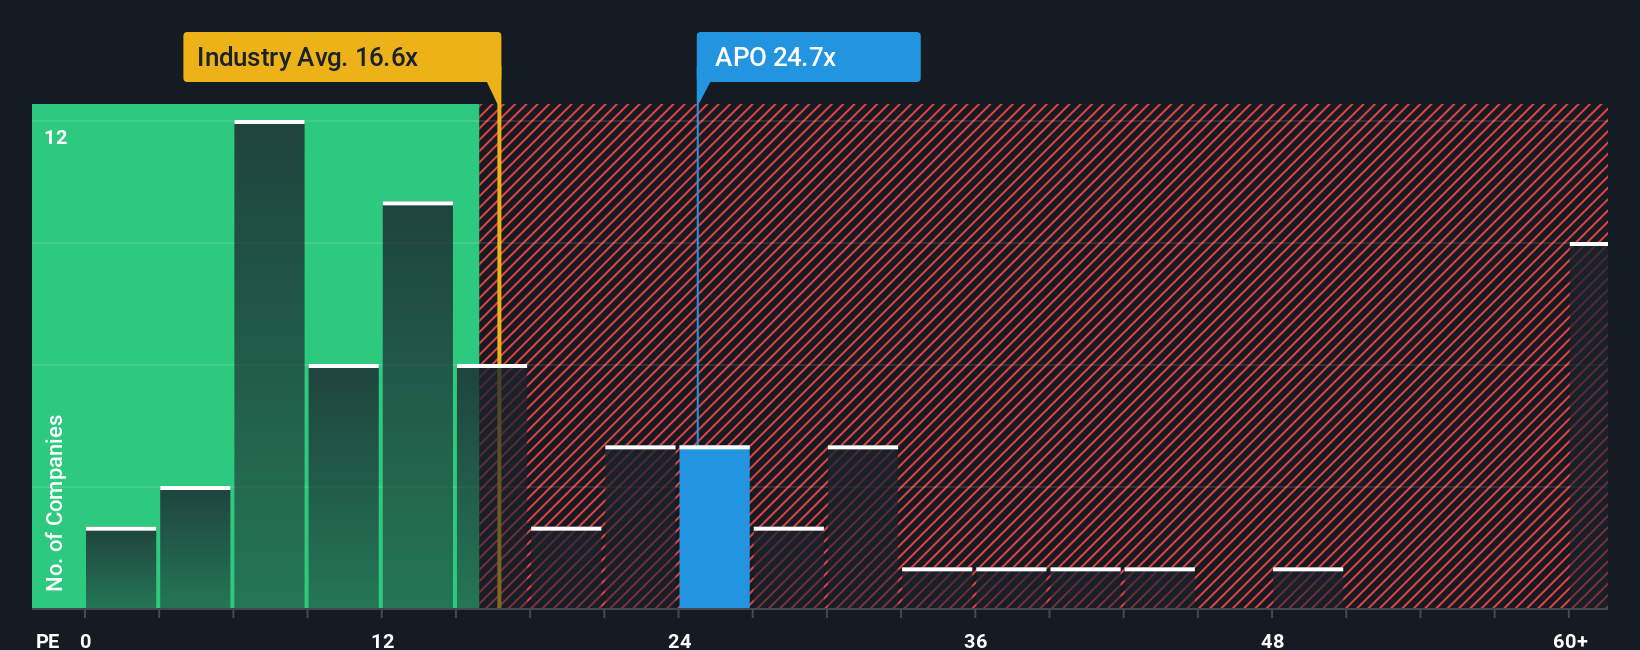
Apollo Global Management currently trades at a PE ratio of 19.1x. This is higher than the industry average of 13.3x and the peer average of 13.1x, suggesting that the market expects stronger growth or perceives less risk compared to its peers. However, Simply Wall St’s proprietary “Fair Ratio” model estimates Apollo's fair PE ratio at 23.3x. The Fair Ratio improves on basic peer or industry comparisons by incorporating key factors such as company-specific earnings growth, profit margins, risks, industry context, and market cap. This offers a more tailored valuation target.
Since Apollo’s current PE ratio is below its Fair Ratio, this analysis indicates that the stock is undervalued based on the PE metric, even after accounting for company quality and industry risks.
Result: UNDERVALUED
PE ratios tell one story, but what if the real opportunity lies elsewhere? Discover 1402 companies where insiders are betting big on explosive growth.
Upgrade Your Decision Making: Choose your Apollo Global Management Narrative
Earlier we mentioned that there is an even better way to understand valuation, so let's introduce you to Narratives. Narratives are your investment story brought to life: a simple tool to express your view of Apollo Global Management’s future by combining your own fair value estimate with your assumptions for revenue, earnings, and margins. They connect your perspective about where the business is headed to a concrete financial forecast, then show you if the stock looks attractive or overvalued today.
You do not have to be an expert to build a Narrative. On Simply Wall St’s Community page, millions of investors easily create and update Narratives in real-time as new news, earnings, or key developments come in. Narratives help you decide if now is the time to buy or sell by directly comparing your estimated Fair Value to the market Price, with the added benefit of seeing how others are thinking too.
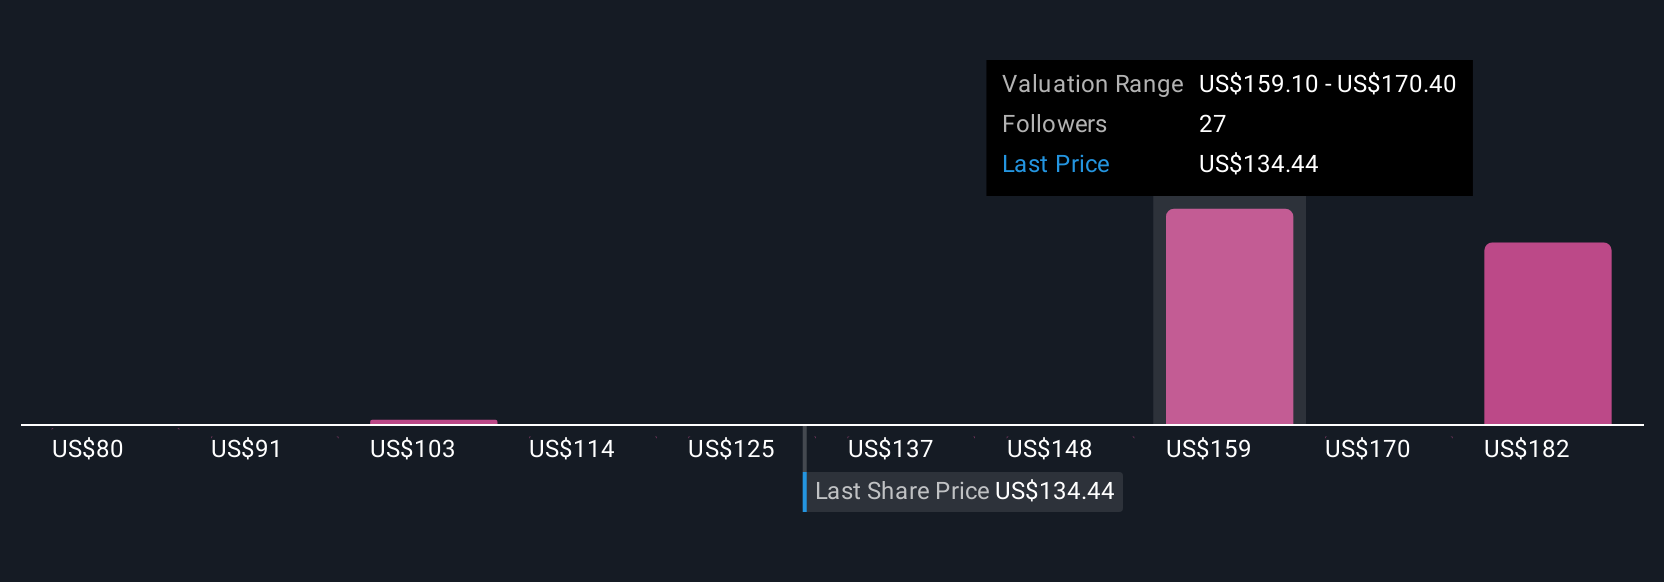
For example, with Apollo Global Management, the most optimistic Narrative sees a fair value of $178.00 per share, while the most cautious Narrative estimates just $117.70. These differences highlight how unique perspectives and new information shape individual investment decisions, making Narratives a flexible and powerful lens through which to evaluate the stock today.
Do you think there's more to the story for Apollo Global Management? Head over to our Community to see what others are saying!
This article by Simply Wall St is general in nature. We provide commentary based on historical data and analyst forecasts only using an unbiased methodology and our articles are not intended to be financial advice. It does not constitute a recommendation to buy or sell any stock, and does not take account of your objectives, or your financial situation. We aim to bring you long-term focused analysis driven by fundamental data. Note that our analysis may not factor in the latest price-sensitive company announcements or qualitative material. Simply Wall St has no position in any stocks mentioned.
New: Manage All Your Stock Portfolios in One Place
We've created the ultimate portfolio companion for stock investors, and it's free.
• Connect an unlimited number of Portfolios and see your total in one currency
• Be alerted to new Warning Signs or Risks via email or mobile
• Track the Fair Value of your stocks
Have feedback on this article? Concerned about the content? Get in touch with us directly. Alternatively, email editorial-team@simplywallst.com
About NYSE:APO
Apollo Global Management
A private equity firm specializing in investments in credit, private equity, infrastructure, secondaries and real estate markets.
Adequate balance sheet and fair value.
Similar Companies
Market Insights

Advertisement
Community Narratives
The "Molecular Pencil": Why Beam's Technology is Built to Win
Fair Value US$65.01|65.4% undervalued
DA
Community Contributor
The silent giant behind virtually every advanced chip powering AI, smartphones, and modern infrastructure.
Fair Value US$310.00|6.1% undervalued
OS
Community Contributor
ADP Stock: Solid Fundamentals, But AI Investments Test Its Margin Resilience
Fair Value US$387.77|34.2% undervalued
YI
Community Contributor
MINISO's fair value is projected at 26.69 with an anticipated PE ratio shift of 20x
Fair Value US$24.03|9.6% undervalued
BE
Community Contributor