Advertisement
- United States
- /
- Capital Markets
- /
- NasdaqGS:STEP
StepStone Group (STEP): Assessing Valuation as Revenue Surges but Losses Deepen After Latest Earnings Release

Simply Wall St
Reviewed by Simply Wall St
StepStone Group (STEP) just released its latest quarterly earnings, showcasing strong year-over-year revenue growth. However, the company also posted a significant net loss, which contrasts sharply with profits from the previous year.
See our latest analysis for StepStone Group.
Following the earnings release and the announcement of another quarterly dividend, StepStone Group’s shares have been notably volatile. Despite a 6.05% share price return year-to-date and a 6.45% gain over the past three months, the latest numbers leave investors weighing the balance between ongoing revenue growth and widening losses. Looking at the bigger picture, momentum has cooled after a strong multiyear run. Total shareholder return is down 1.73% over the past year but still delivers a standout 124.86% total return over three years.
If today’s swings have you curious about what else is moving, now’s a great time to broaden your investing horizons and discover fast growing stocks with high insider ownership
With such a dramatic shift between robust revenue growth and widening losses, the real question for investors now is whether StepStone Group’s share price undervalues its future prospects or if the market has already priced in all that upcoming growth.
Price-to-Sales of 3.6x: Is it justified?
StepStone Group currently trades at a price-to-sales ratio of 3.6x, which suggests its shares could be considered expensive relative to the business's revenue, especially since its price exceeds our estimated fair ratio.
The price-to-sales (P/S) ratio measures how much investors are paying for each dollar of sales. This metric is especially important for companies that may not be profitable but are still generating significant revenue, as it helps highlight whether the market is optimistic about future growth or overestimating the company’s prospects.
Looking closer, StepStone Group's P/S ratio of 3.6x is lower than the peer average of 5.9x and slightly below the US Capital Markets industry average of 3.9x. This may indicate a relative discount. However, it is well above the estimated fair price-to-sales ratio of 1.5x, which could imply the broader market may push valuations lower for companies in a similar position.
Explore the SWS fair ratio for StepStone Group
Result: Preferred multiple of price-to-sales 3.6x (OVERVALUED)
However, slowing revenue growth or persistent net losses could quickly shift market sentiment and put further pressure on StepStone Group’s current valuation.
Find out about the key risks to this StepStone Group narrative.
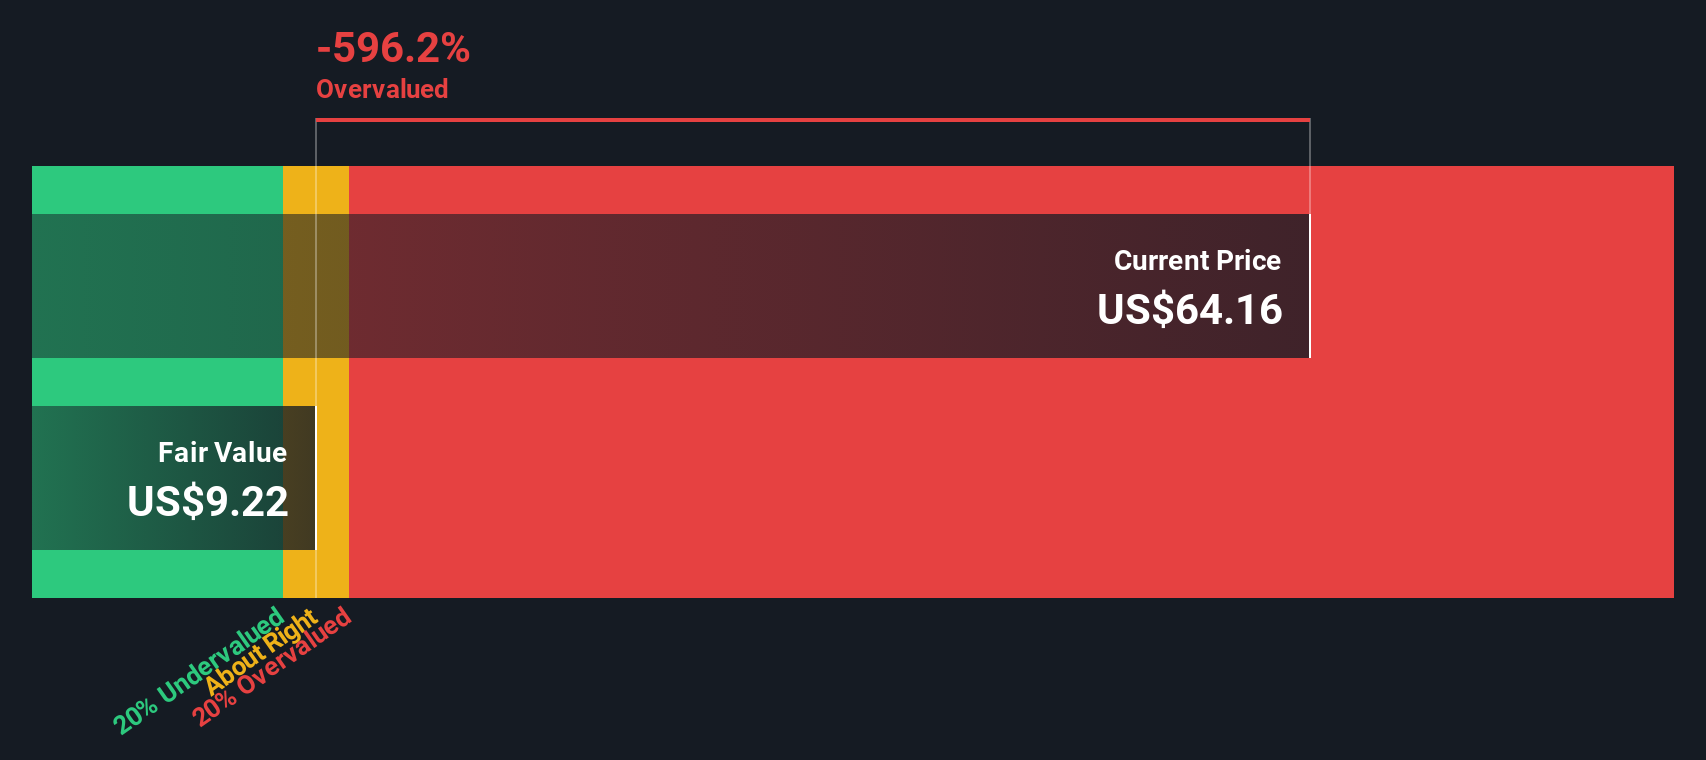
Another View: SWS DCF Model Signals Overvaluation
The SWS DCF model, an intrinsic value approach that forecasts future cash flows, casts StepStone Group in a less favorable light. According to this method, shares are trading well above the estimated fair value, which points to a potential risk if market optimism fades. Can this gap be justified, or is it a warning for investors?
Look into how the SWS DCF model arrives at its fair value.
Simply Wall St performs a discounted cash flow (DCF) on every stock in the world every day (check out StepStone Group for example). We show the entire calculation in full. You can track the result in your watchlist or portfolio and be alerted when this changes, or use our stock screener to discover 859 undervalued stocks based on their cash flows. If you save a screener we even alert you when new companies match - so you never miss a potential opportunity.
Build Your Own StepStone Group Narrative
If you think differently or want to see the numbers for yourself, it only takes a few minutes to craft your own perspective, so Do it your way.
A great starting point for your StepStone Group research is our analysis highlighting 1 key reward and 2 important warning signs that could impact your investment decision.
Looking for more investment ideas?
Smart investors never limit their options. Take action now to uncover unique stocks that could transform your portfolio and give you an edge over the crowd.
- Unlock high potential returns by exploring these 859 undervalued stocks based on cash flows that could be trading for less than their intrinsic worth.
- Capitalize on emerging tech trends by targeting these 25 AI penny stocks that are shaping tomorrow’s innovation in artificial intelligence.
- Boost your income stream with these 17 dividend stocks with yields > 3% offering attractive above-average yields.
This article by Simply Wall St is general in nature. We provide commentary based on historical data and analyst forecasts only using an unbiased methodology and our articles are not intended to be financial advice. It does not constitute a recommendation to buy or sell any stock, and does not take account of your objectives, or your financial situation. We aim to bring you long-term focused analysis driven by fundamental data. Note that our analysis may not factor in the latest price-sensitive company announcements or qualitative material. Simply Wall St has no position in any stocks mentioned.
New: Manage All Your Stock Portfolios in One Place
We've created the ultimate portfolio companion for stock investors, and it's free.
• Connect an unlimited number of Portfolios and see your total in one currency
• Be alerted to new Warning Signs or Risks via email or mobile
• Track the Fair Value of your stocks
Have feedback on this article? Concerned about the content? Get in touch with us directly. Alternatively, email editorial-team@simplywallst.com
About NasdaqGS:STEP
StepStone Group
A private equity and venture capital firm specializing in primary, direct, fund of funds, secondary direct, and secondary indirect investments.
Adequate balance sheet and fair value.
Similar Companies
Market Insights

Advertisement
Community Narratives
The company that turned a verb into a global necessity and basically runs the modern internet, digital ads, smartphones, maps, and AI.
Fair Value US$300.00|5.1% undervalued
OS
Community Contributor
Flowers Foods Pays A Fair Price For Health
Fair Value US$16.12|27.7% undervalued
NV
Community Contributor
TMX Group will thrive with 33.3% profit margin and enduring market moat
Fair Value CA$49.90|0.2% overvalued
LI
Community Contributor
The "Molecular Pencil": Why Beam's Technology is Built to Win
Fair Value US$65.01|64.4% undervalued
DA
Community Contributor