Advertisement
- United States
- /
- Luxury
- /
- NasdaqGS:LULU
Has the 54% Drop in Lululemon Shares Created a 2025 Bargain Opportunity?

Simply Wall St
Reviewed by Bailey Pemberton
- Wondering if lululemon athletica’s beaten-down share price could mean it is an undervalued opportunity, or if there is more risk than meets the eye? You are not the only one, and we are about to break it down.
- Despite a 2.0% jump in the past week and a slight 0.6% gain over the last month, lululemon stock is still down a staggering 54.1% year-to-date and nearly 48% over the last year.
- Recent headlines have highlighted a broader sector pullback and rising competition, with analysts weighing in on shifting consumer trends. Several major retailers have also reported cautious outlooks, adding extra pressure to performance expectations across athletic wear stocks.
- With a current valuation score of 5 out of 6, lululemon passes most of our value checks. However, digging deeper into how those numbers are calculated reveals some important nuances. First, let us explore the traditional valuation methods, and then look at a smarter way to assess value at the end of this article.
Find out why lululemon athletica's -47.9% return over the last year is lagging behind its peers.
Approach 1: lululemon athletica Discounted Cash Flow (DCF) Analysis
The Discounted Cash Flow (DCF) model estimates a company's value by projecting its future cash flows and discounting them to today's dollars. For lululemon athletica, this approach uses current and forecasted Free Cash Flow figures in $ to estimate intrinsic value.
lululemon's latest reported Free Cash Flow is about $1.16 Billion. Analysts project growth in the coming years, with Free Cash Flow expected to reach $1.60 Billion by 2030. Estimates for the next five years are based on analyst forecasts, while projections beyond that are generated using trend assumptions.
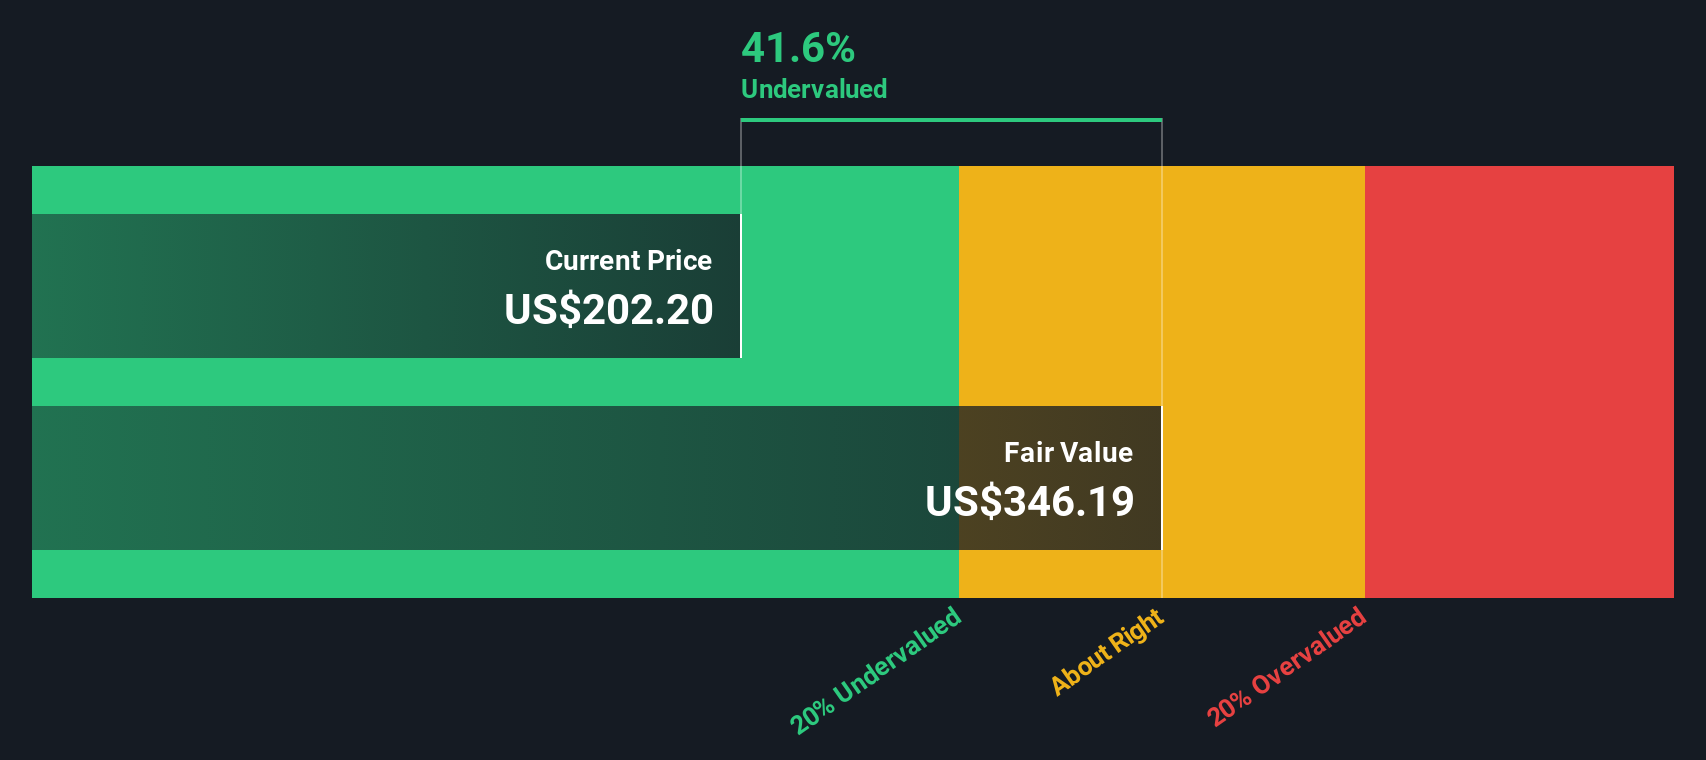
The DCF calculation indicates that the fair value per share is about $255.41. This method suggests lululemon shares are trading at a 33.1% discount compared to this estimated intrinsic value, suggesting the stock may be undervalued based on its future cash flow potential.
In summary, the DCF suggests that current share prices may not fully reflect lululemon’s long-term earning power.
Result: UNDERVALUED
Our Discounted Cash Flow (DCF) analysis suggests lululemon athletica is undervalued by 33.1%. Track this in your watchlist or portfolio, or discover 883 more undervalued stocks based on cash flows.
Approach 2: lululemon athletica Price vs Earnings
The Price-to-Earnings (PE) ratio is a widely used valuation tool for assessing profitable companies, especially those with a steady record of positive earnings like lululemon athletica. This metric essentially tells investors how much they are paying for each dollar of a company’s earnings, making it a clear indicator of market expectations about profit and growth.
Growth outlook and perceived risk play a big role in what counts as a “normal” or “fair” PE ratio. Companies with strong growth prospects and lower risks often trade at higher PE ratios, while slower growing or riskier companies see lower multiples. Comparing a stock’s current PE ratio to key benchmarks provides helpful context.
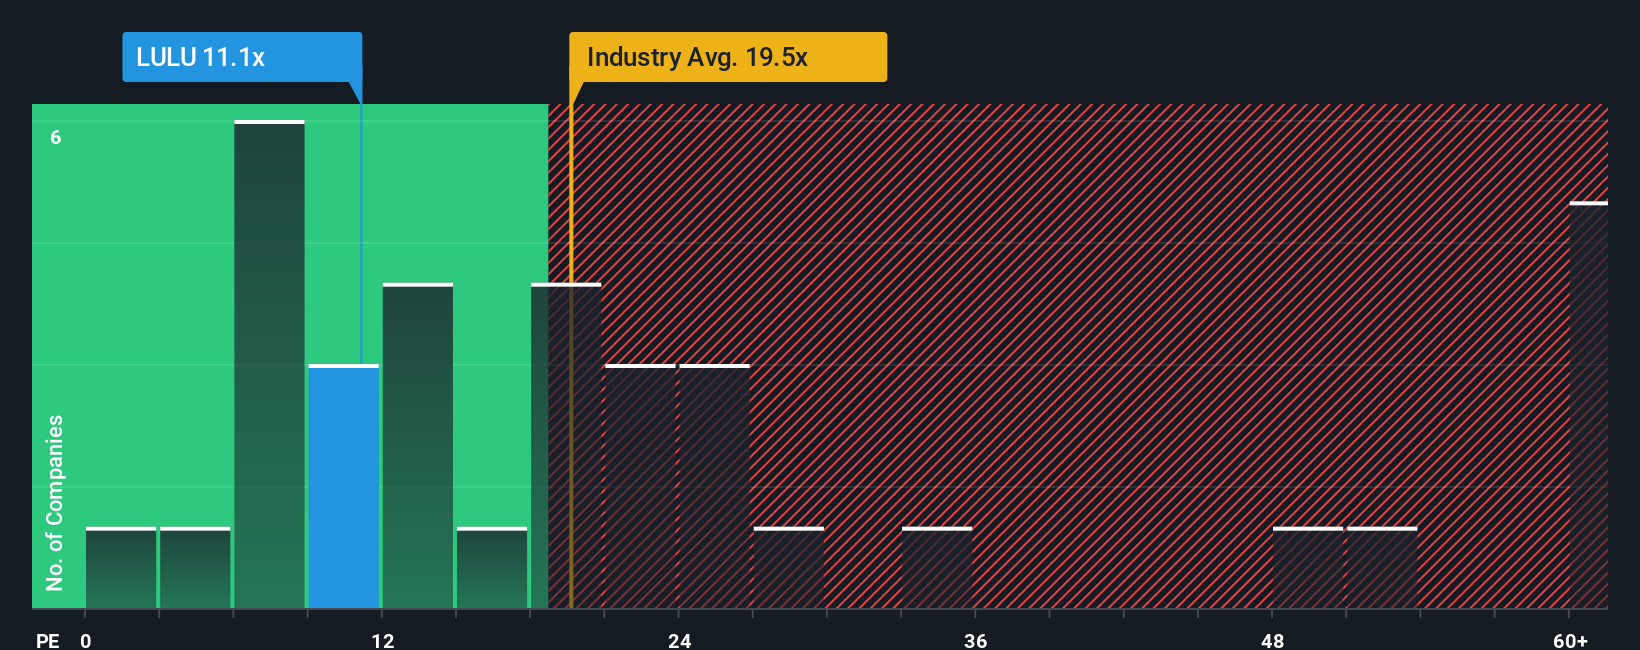
lululemon’s current PE ratio is 11.3x, notably below both its peer average of 49.1x and the luxury industry average of 18.6x. While this might suggest the stock is undervalued, raw comparisons like these can miss the bigger picture. Factors such as growth rates, market cap, profit margins, and risk profile are also important. That is where Simply Wall St’s “Fair Ratio” offers a more tailored benchmark. The Fair Ratio, calculated as 15.6x for lululemon, reflects all these relevant factors and provides a more reliable gauge of what the stock’s PE should be under current circumstances.
With lululemon’s PE ratio of 11.3x sitting below its Fair Ratio of 15.6x, the analysis indicates the shares are undervalued by this approach as well.
Result: UNDERVALUED
PE ratios tell one story, but what if the real opportunity lies elsewhere? Discover 1403 companies where insiders are betting big on explosive growth.
Upgrade Your Decision Making: Choose your lululemon athletica Narrative
Earlier, we mentioned that there is an even better way to understand valuation, so let us introduce you to Narratives. This user-friendly approach connects your view of a company's story directly to its financial forecast and fair value.
A Narrative is your personal perspective on what drives a company’s future, shaping your expectations for things like revenue growth, profit margins, discount rates, and ultimately, what you consider a fair price for the shares. Instead of only looking at static numbers, Narratives let you express your view — whether bullish, bearish, or somewhere in between — and see how it impacts the company's valuation using up-to-date forecasts and easy-to-understand models.
Available right on Simply Wall St’s Community page, millions of investors use Narratives to clarify their investment stance and instantly compare their estimate of fair value with the current price. This makes it easier to decide when to buy or sell. These Narratives update dynamically whenever news or earnings reports are released, so your estimates stay relevant.
For lululemon athletica, for example, some investors might see continued international expansion and resilient demand, assigning a high fair value, while others, wary of U.S. headwinds and shrinking profit margins, assign a much lower value. Narratives let you choose the story that best fits your investment outlook and see its financial impact instantly.
Do you think there's more to the story for lululemon athletica? Head over to our Community to see what others are saying!
This article by Simply Wall St is general in nature. We provide commentary based on historical data and analyst forecasts only using an unbiased methodology and our articles are not intended to be financial advice. It does not constitute a recommendation to buy or sell any stock, and does not take account of your objectives, or your financial situation. We aim to bring you long-term focused analysis driven by fundamental data. Note that our analysis may not factor in the latest price-sensitive company announcements or qualitative material. Simply Wall St has no position in any stocks mentioned.
Valuation is complex, but we're here to simplify it.
Discover if lululemon athletica might be undervalued or overvalued with our detailed analysis, featuring fair value estimates, potential risks, dividends, insider trades, and its financial condition.
Access Free AnalysisHave feedback on this article? Concerned about the content? Get in touch with us directly. Alternatively, email editorial-team@simplywallst.com
About NasdaqGS:LULU
lululemon athletica
Designs, distributes, and retails technical athletic apparel, footwear, and accessories for women and men under the lululemon brand in the United States, Canada, Mexico, China Mainland, Hong Kong, Taiwan, Macau, and internationally.
Flawless balance sheet and undervalued.
Similar Companies
Market Insights

Advertisement
Community Narratives
MINISO's fair value is projected at 26.69 with an anticipated PE ratio shift of 20x
Fair Value US$24.03|9.0% undervalued
BE
Community Contributor
Procter & Gamble: A Dividend Giant Facing Slowing Growth
Fair Value US$119.81|23.5% overvalued
AN
Community Contributor
Eli Lilly's Future Growth Driven by Tirzepatide and Favorable Market Conditions
Fair Value US$1.19k|14.4% undervalued
EA
Community Contributor