
Advertisement
- United States
- /
- Luxury
- /
- NasdaqGS:GIII
G-III Apparel Group (NASDAQ:GIII) stock performs better than its underlying earnings growth over last five years

When you buy a stock there is always a possibility that it could drop 100%. But when you pick a company that is really flourishing, you can make more than 100%. For example, the G-III Apparel Group, Ltd. (NASDAQ:GIII) share price has soared 113% in the last half decade. Most would be very happy with that. And in the last month, the share price has gained 14%. But the price may well have benefitted from a buoyant market, since stocks have gained 6.7% in the last thirty days.
The past week has proven to be lucrative for G-III Apparel Group investors, so let's see if fundamentals drove the company's five-year performance.
To quote Buffett, 'Ships will sail around the world but the Flat Earth Society will flourish. There will continue to be wide discrepancies between price and value in the marketplace...' One way to examine how market sentiment has changed over time is to look at the interaction between a company's share price and its earnings per share (EPS).
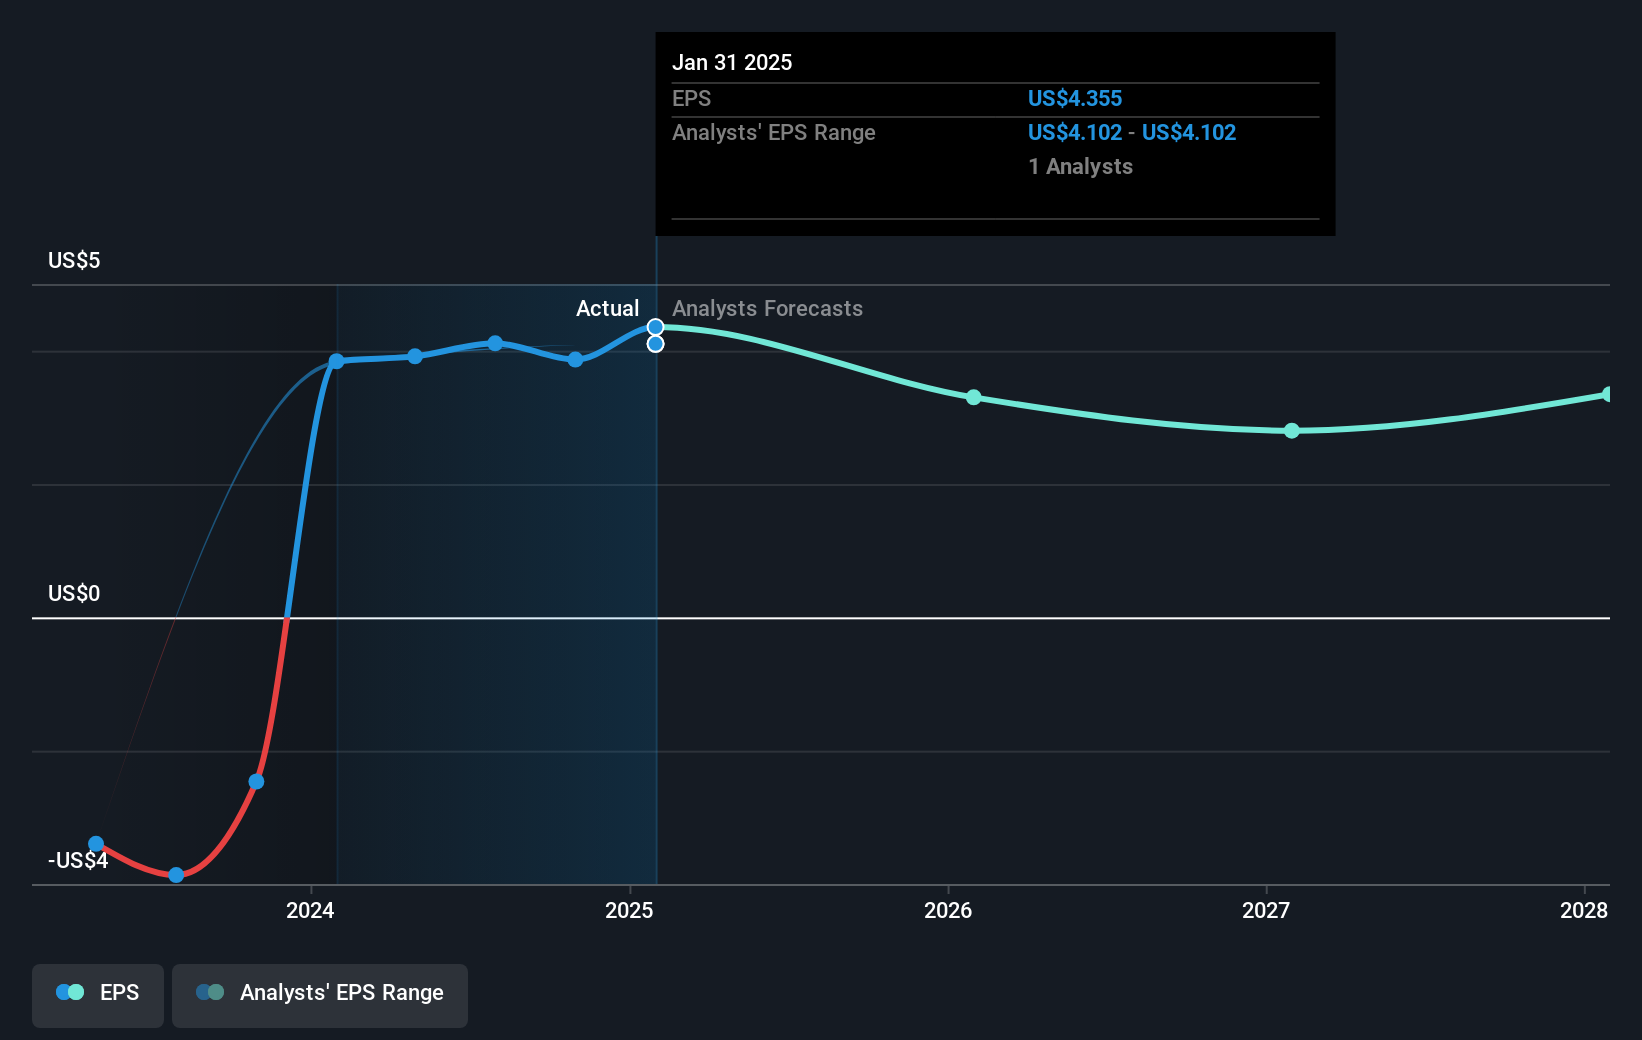
During five years of share price growth, G-III Apparel Group achieved compound earnings per share (EPS) growth of 8.4% per year. This EPS growth is lower than the 16% average annual increase in the share price. This suggests that market participants hold the company in higher regard, these days. That's not necessarily surprising considering the five-year track record of earnings growth.
You can see how EPS has changed over time in the image below (click on the chart to see the exact values).
We know that G-III Apparel Group has improved its bottom line lately, but is it going to grow revenue? You could check out this free report showing analyst revenue forecasts.
A Different Perspective
G-III Apparel Group shareholders are down 1.7% for the year, but the market itself is up 13%. Even the share prices of good stocks drop sometimes, but we want to see improvements in the fundamental metrics of a business, before getting too interested. Longer term investors wouldn't be so upset, since they would have made 16%, each year, over five years. If the fundamental data continues to indicate long term sustainable growth, the current sell-off could be an opportunity worth considering. If you would like to research G-III Apparel Group in more detail then you might want to take a look at whether insiders have been buying or selling shares in the company.
Of course G-III Apparel Group may not be the best stock to buy. So you may wish to see this free collection of growth stocks.
Please note, the market returns quoted in this article reflect the market weighted average returns of stocks that currently trade on American exchanges.
New: Manage All Your Stock Portfolios in One Place
We've created the ultimate portfolio companion for stock investors, and it's free.
• Connect an unlimited number of Portfolios and see your total in one currency
• Be alerted to new Warning Signs or Risks via email or mobile
• Track the Fair Value of your stocks
Have feedback on this article? Concerned about the content? Get in touch with us directly. Alternatively, email editorial-team (at) simplywallst.com.
This article by Simply Wall St is general in nature. We provide commentary based on historical data and analyst forecasts only using an unbiased methodology and our articles are not intended to be financial advice. It does not constitute a recommendation to buy or sell any stock, and does not take account of your objectives, or your financial situation. We aim to bring you long-term focused analysis driven by fundamental data. Note that our analysis may not factor in the latest price-sensitive company announcements or qualitative material. Simply Wall St has no position in any stocks mentioned.
About NasdaqGS:GIII
G-III Apparel Group
Designs, sources, distributes, and markets women’s and men’s apparel in the United States and internationally.
Flawless balance sheet with solid track record.
Similar Companies
Market Insights

Advertisement
Community Narratives
MicroStrategy: Volatile Gamble or Golden Opportunity?
Fair Value US$663.00|31.9% undervalued
BL
Community Contributor
Emerging Markets and Debt Reduction Will Propel Bath & Body Works Forward
Fair Value US$40.73|22.1% undervalued
ZW
Community Contributor
An amazing opportunity to potentially get a 100 bagger
Fair Value US$10.00|36.0% overvalued
DA
Community Contributor