Advertisement
- United States
- /
- Luxury
- /
- NasdaqGS:CROX
Is Crocs Now a Bargain After a 25% Drop in 2025?

Simply Wall St
Reviewed by Bailey Pemberton
- Ever wondered if Crocs stock is finally a bargain, or just cheap for a reason? You are not alone. Price-conscious investors have been eyeing its next moves for clues on value.
- Crocs has seen some turbulence lately, with the share price dropping 1.4% over the last week and down 25.8% year-to-date. Its longer-term 5-year return sits at 40.0%.
- Recent headlines have highlighted Crocs' ongoing product launches and expansion of its brand collaborations, keeping it in the consumer spotlight. Market chatter also circles around the company's efforts to navigate shifting consumer demand and evolving retail trends.
- According to our checks, Crocs scores a 3 out of 6 on our valuation scorecard. This reflects that it appears undervalued in half of the key metrics we track. Next, let’s dive into the different ways investors break down a stock’s value, while saving the most insightful approach for the end.
Find out why Crocs's -23.1% return over the last year is lagging behind its peers.
Approach 1: Crocs Discounted Cash Flow (DCF) Analysis
A Discounted Cash Flow (DCF) model estimates a company's intrinsic value by projecting its future cash flows and discounting them back to today’s dollars. This method is particularly valued for its focus on hard cash generation, offering investors a grounded sense of long-term worth.
For Crocs, the current Free Cash Flow (FCF) stands at $697.4 million. Analyst forecasts extend forward to 2027, with FCF projected at $625.9 million. Beyond that, Simply Wall St extrapolates future cash flows and forecasts a gradual increase. Ten years out, in 2035, the estimated FCF is $668.6 million. All figures are in US dollars and remain below the billion mark, highlighting steady but contained cash generation.
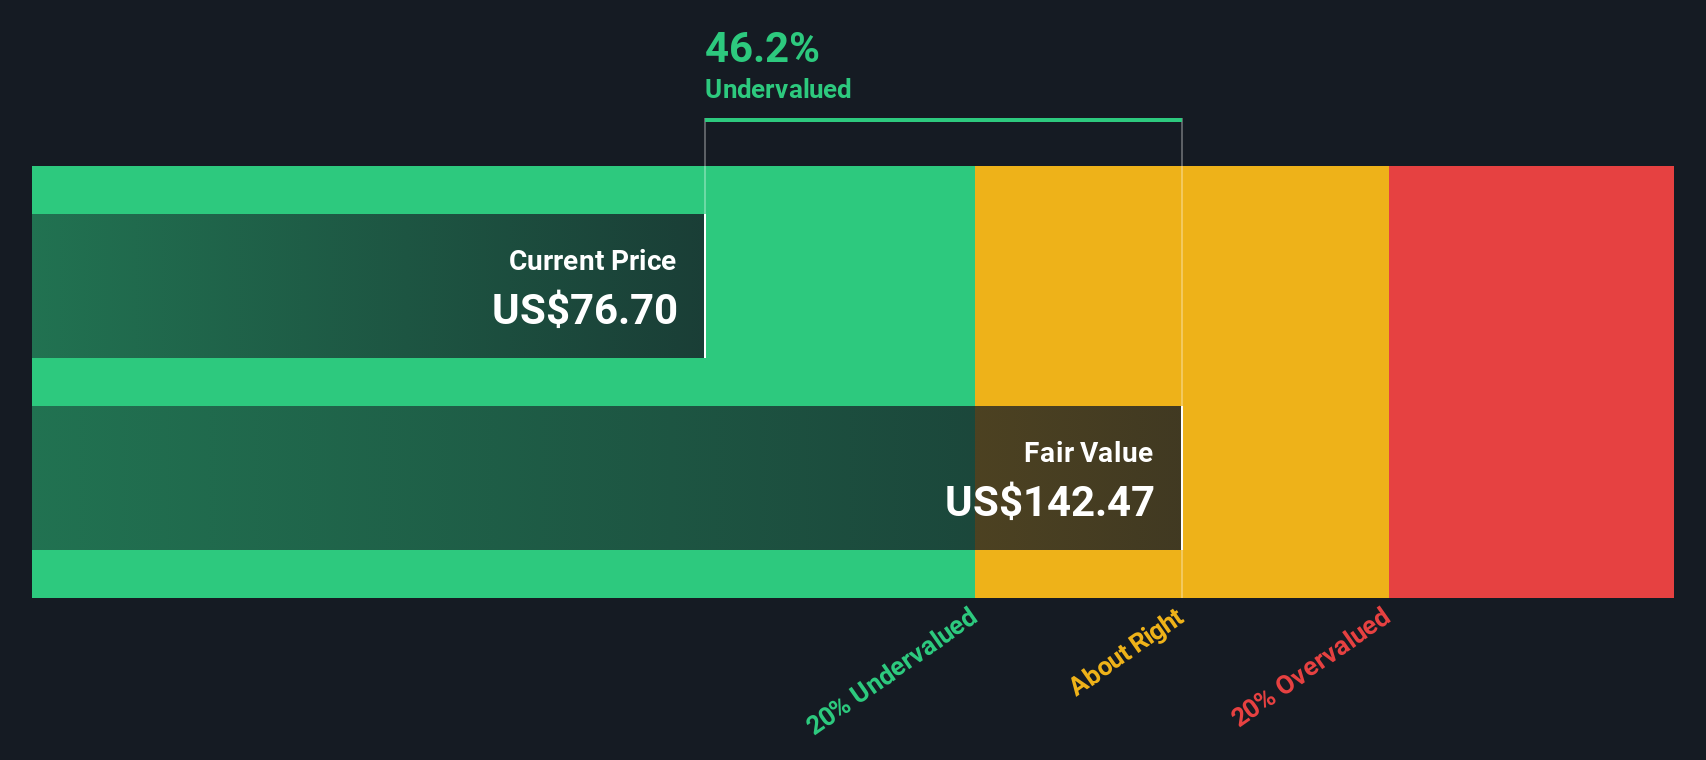
Applying these projections to the DCF model and discounting appropriately, Crocs’ intrinsic value is calculated at $156.83 per share. This represents an estimated 47.9% discount to the current share price, suggesting the stock could be significantly undervalued based on future cash flows.
Result: UNDERVALUED
Our Discounted Cash Flow (DCF) analysis suggests Crocs is undervalued by 47.9%. Track this in your watchlist or portfolio, or discover 839 more undervalued stocks based on cash flows.
Approach 2: Crocs Price vs Earnings (PE)
The Price-to-Earnings (PE) ratio is often the go-to valuation metric for profitable companies like Crocs, as it measures how much investors are willing to pay for each dollar of earnings. This makes it a practical way to compare a company's current price tag with how much it actually earns, shining a light on investor expectations.
It is worth noting that growth prospects and risk play a key role in what is considered a "normal" or "fair" PE ratio for any company. Higher growth companies tend to command above-average PE multiples, as investors price in future earnings potential. Meanwhile, elevated risks, such as volatile earnings or changing industry conditions, may lower what is seen as a justified PE.
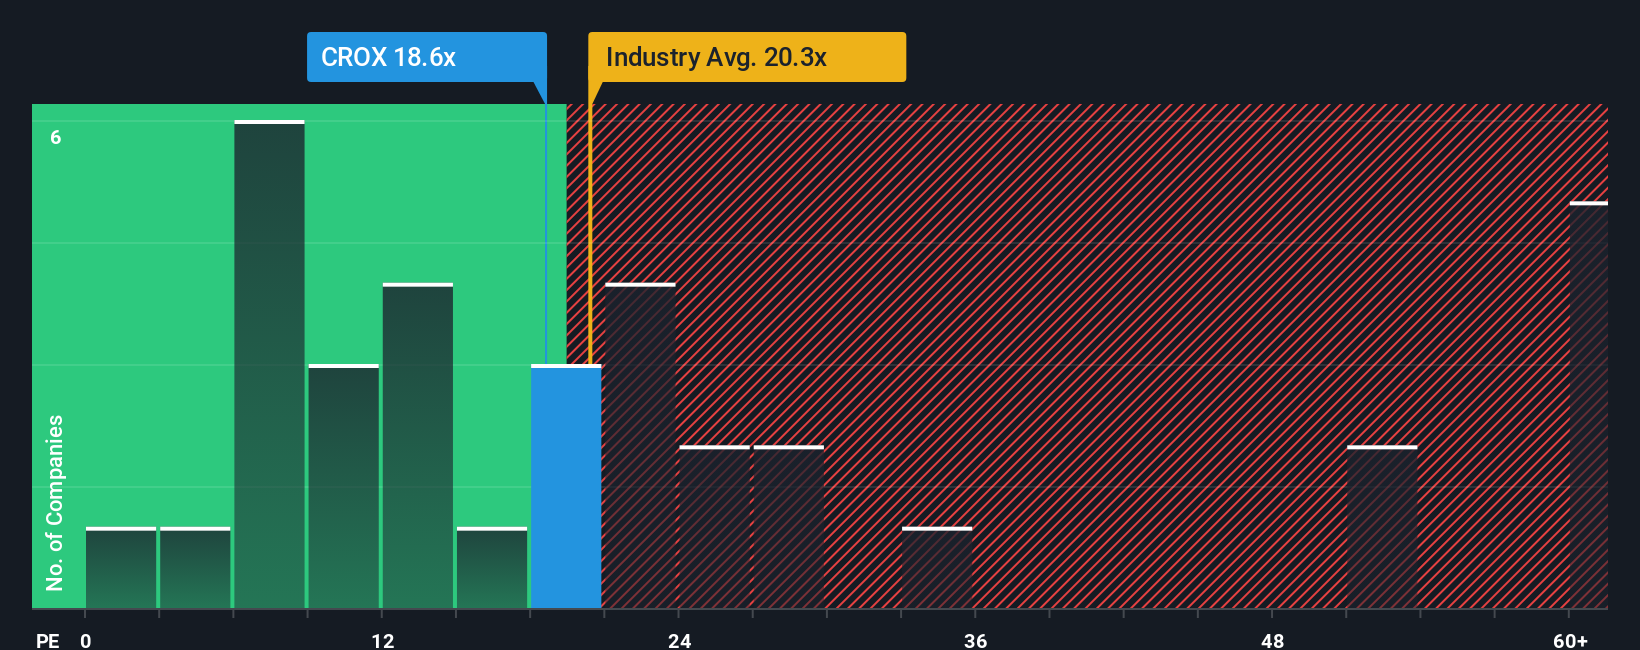
Crocs currently trades at a PE of 23.4x, which stands above the Luxury industry average of 19.5x and the average of its closest peers at 15.8x. At first glance, this premium might seem concerning. However, Simply Wall St calculates a “Fair Ratio” of 58.9x for Crocs, a proprietary benchmark that incorporates not just the company’s earnings growth but also factors in profit margins, industry context, market cap, and risk factors. Unlike simple peer or industry comparisons, this Fair Ratio delivers a more complete evaluation of what Crocs’ multiple could reasonably be.
Since Crocs’ actual PE (23.4x) is well below its Fair Ratio (58.9x), the stock appears undervalued using this method, despite trading at a premium to industry and peer averages.
Result: UNDERVALUED
PE ratios tell one story, but what if the real opportunity lies elsewhere? Discover 1412 companies where insiders are betting big on explosive growth.
Upgrade Your Decision Making: Choose your Crocs Narrative
Earlier we mentioned that there is an even better way to understand valuation, so let's introduce you to Narratives. A Narrative is your investment story—a set of your own fair value and future growth estimates—which brings a company’s financials to life by connecting the numbers to your expectations and outlook for its business.
Simply Wall St’s Narratives let you turn your personal insights into forecasts, linking your view of Crocs’ brand strengths, risks, and long-term prospects directly to dynamic models of revenue, margins, and fair value. Narratives are designed for anyone to use. The tool is available within the Simply Wall St Community page and allows millions of investors to transparently compare their assumptions, see how the investment case changes over time, and decide when Crocs might be fairly valued or ready for action.
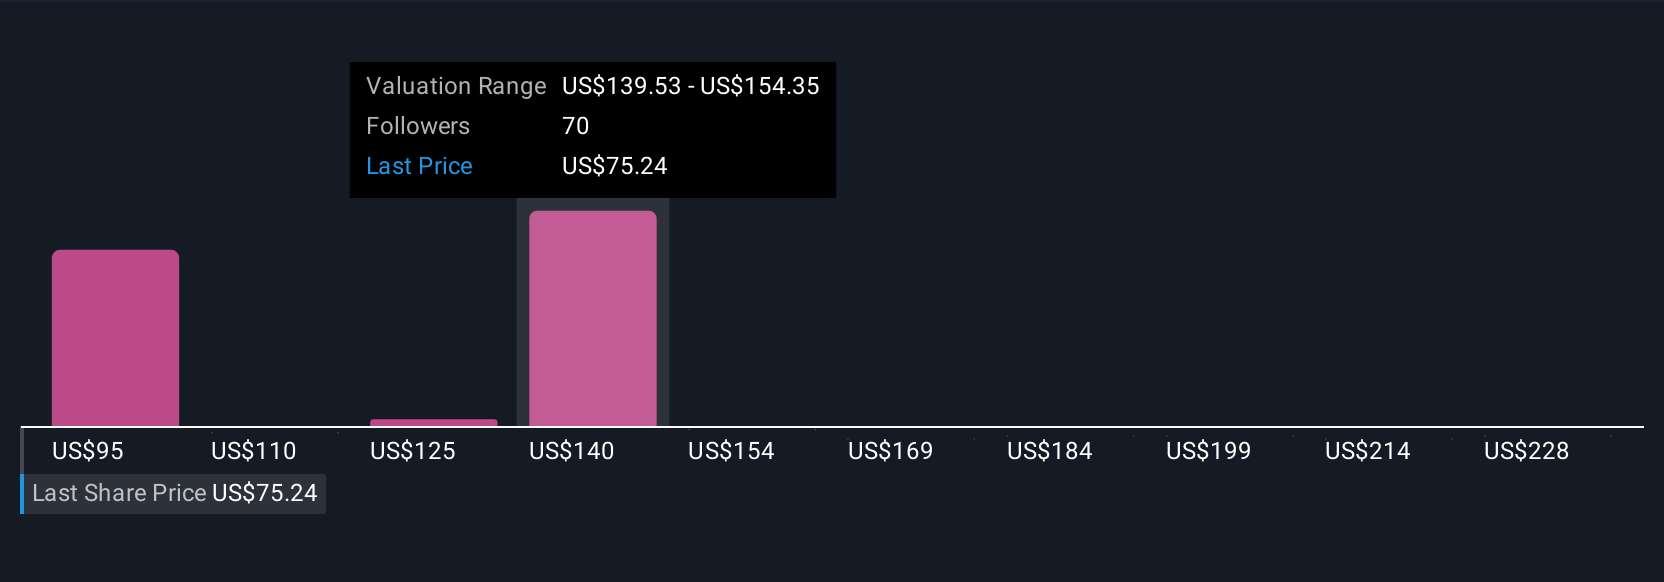
The real power of Narratives is that they automatically update as new information arrives, so your fair value will always reflect the latest news or earnings. Picture two investors: one models modest, steady growth and sees Crocs as fairly worth $151 per share, while another, more cautious, estimates a lower fair value near $67 based on weaker sales and market pressures. This shows how different perspectives can lead to very different decisions, all from the same set of tools.
Do you think there's more to the story for Crocs? Head over to our Community to see what others are saying!
This article by Simply Wall St is general in nature. We provide commentary based on historical data and analyst forecasts only using an unbiased methodology and our articles are not intended to be financial advice. It does not constitute a recommendation to buy or sell any stock, and does not take account of your objectives, or your financial situation. We aim to bring you long-term focused analysis driven by fundamental data. Note that our analysis may not factor in the latest price-sensitive company announcements or qualitative material. Simply Wall St has no position in any stocks mentioned.
New: AI Stock Screener & Alerts
Our new AI Stock Screener scans the market every day to uncover opportunities.
• Dividend Powerhouses (3%+ Yield)
• Undervalued Small Caps with Insider Buying
• High growth Tech and AI Companies
Or build your own from over 50 metrics.
Have feedback on this article? Concerned about the content? Get in touch with us directly. Alternatively, email editorial-team@simplywallst.com
About NasdaqGS:CROX
Crocs
Designs, develops, manufactures, markets, distributes, and sells casual lifestyle footwear and accessories for men, women, and children under the Crocs and HEYDUDE Brands in the United States and internationally.
Good value with reasonable growth potential.
Similar Companies
Market Insights

Advertisement
Community Narratives
The "Molecular Pencil": Why Beam's Technology is Built to Win
Fair Value US$65.01|65.4% undervalued
DA
Community Contributor
The silent giant behind virtually every advanced chip powering AI, smartphones, and modern infrastructure.
Fair Value US$310.00|6.1% undervalued
OS
Community Contributor
ADP Stock: Solid Fundamentals, But AI Investments Test Its Margin Resilience
Fair Value US$387.77|34.2% undervalued
YI
Community Contributor
MINISO's fair value is projected at 26.69 with an anticipated PE ratio shift of 20x
Fair Value US$24.03|9.6% undervalued
BE
Community Contributor