Advertisement
- United States
- /
- Aerospace & Defense
- /
- NasdaqGM:FLY
Firefly Aerospace (FLY): Examining Valuation After Earnings Disappoint, Revenue Drops, and Legal Action Escalates

Simply Wall St
Reviewed by Simply Wall St
Firefly Aerospace (FLY) has found itself under extra scrutiny after releasing its first quarterly results as a public company. The report showed a sharp drop in revenue and higher operating expenses compared to the previous year.
This financial update triggered a significant decline in Firefly’s stock price, and several law firms have since launched investigations focused on possible securities law violations and investor losses.
See our latest analysis for Firefly Aerospace.
Firefly Aerospace’s latest share price of $19.24 marks a steep retreat, with the 30-day share price return down 32% and year-to-date losses now topping 68%. Despite headline-grabbing moves such as its $855 million SciTec acquisition and a major credit facility boost, investor sentiment has clearly turned cautious. This signals that growth ambitions are being weighed carefully against recent financial setbacks and rising risks.
If Firefly’s volatility has you scanning the broader sector, now is a good time to check out other aerospace and defense opportunities with our See the full list for free.
But with shares now trading well below analyst price targets and investor sentiment hitting new lows, is this a rare chance to buy Firefly Aerospace at a discount, or is the market already taking all future growth into account?
Price-to-Sales Ratio of 27.4x: Is it justified?
Firefly Aerospace’s shares closed at $19.24, but its price-to-sales ratio stands at 27.4x, which is substantially higher than both peer and industry averages. This signals a premium valuation despite recent losses.
The price-to-sales ratio measures how much investors are willing to pay per dollar of a company’s revenue. For capital-intensive companies like Firefly Aerospace, this metric provides a useful cross-check, especially when earnings are negative. However, a high ratio often reflects market expectations of strong future revenue growth or unique business prospects.
At 27.4x, Firefly appears much more expensive than the average in both its immediate peer group at 1.2x and the broader US Aerospace & Defense industry at 3x. This significant gap suggests the market is pricing in rapid growth and possibly technological advantages, but it also raises the hurdle for future performance.
See what the numbers say about this price — find out in our valuation breakdown.
Result: Price-to-Sales of 27.4x (OVERVALUED)
However, ongoing net losses and a steep revenue decline may continue to weigh on sentiment. These factors may challenge any near-term turnaround for Firefly Aerospace.
Find out about the key risks to this Firefly Aerospace narrative.
Another View: Discounted Cash Flow Paints a Different Picture
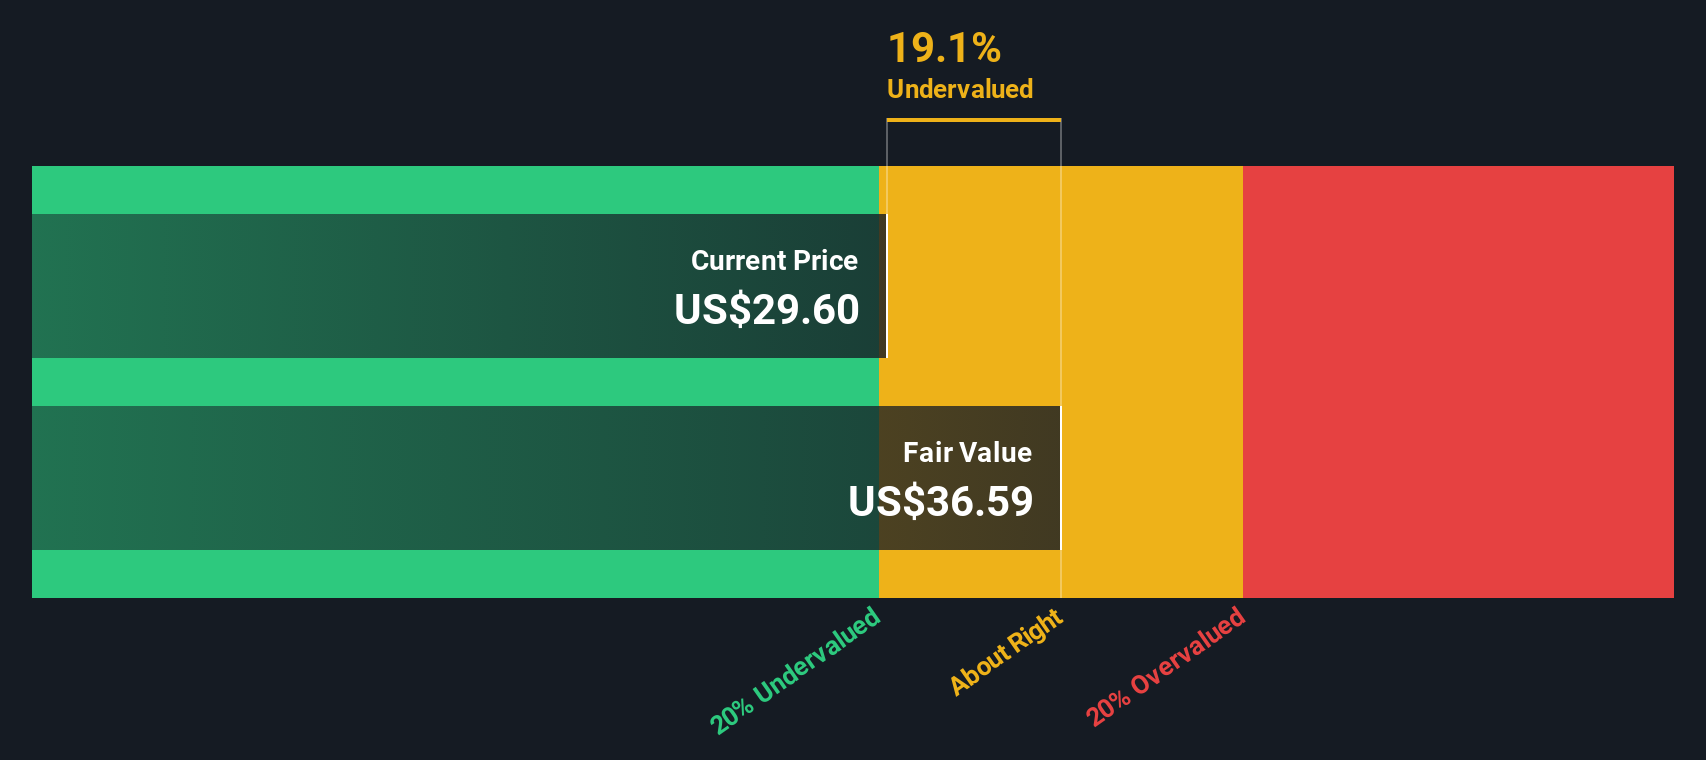
While the price-to-sales ratio points to a steep valuation, our DCF model offers a more optimistic outlook. By estimating future cash flows and discounting them to today’s terms, the SWS DCF model suggests Firefly Aerospace could actually be undervalued at its current price. Are investors missing a potential bargain, or is the DCF model too hopeful in forecasting recovery?
Look into how the SWS DCF model arrives at its fair value.
Simply Wall St performs a discounted cash flow (DCF) on every stock in the world every day (check out Firefly Aerospace for example). We show the entire calculation in full. You can track the result in your watchlist or portfolio and be alerted when this changes, or use our stock screener to discover 874 undervalued stocks based on their cash flows. If you save a screener we even alert you when new companies match - so you never miss a potential opportunity.
Build Your Own Firefly Aerospace Narrative
If you see things differently or want to investigate the numbers on your own terms, you can build your own view in just a few minutes with our easy-to-use tools. Do it your way
A great starting point for your Firefly Aerospace research is our analysis highlighting 3 key rewards and 1 important warning sign that could impact your investment decision.
Looking for more investment ideas?
Don’t limit your watchlist to one sector. The Simply Wall Street Screener puts you ahead of the curve with hand-picked stocks that could spark your next big move.
- Unlock fresh opportunities among tech-driven innovators by checking out these 24 AI penny stocks built for rapid growth and AI leadership.
- Secure stable income for your portfolio by reviewing these 16 dividend stocks with yields > 3% with yields over 3% and solid fundamentals.
- Capitalize on the next wave in finance by tapping into these 82 cryptocurrency and blockchain stocks actively shaping the future of decentralized technology.
This article by Simply Wall St is general in nature. We provide commentary based on historical data and analyst forecasts only using an unbiased methodology and our articles are not intended to be financial advice. It does not constitute a recommendation to buy or sell any stock, and does not take account of your objectives, or your financial situation. We aim to bring you long-term focused analysis driven by fundamental data. Note that our analysis may not factor in the latest price-sensitive company announcements or qualitative material. Simply Wall St has no position in any stocks mentioned.
New: AI Stock Screener & Alerts
Our new AI Stock Screener scans the market every day to uncover opportunities.
• Dividend Powerhouses (3%+ Yield)
• Undervalued Small Caps with Insider Buying
• High growth Tech and AI Companies
Or build your own from over 50 metrics.
Have feedback on this article? Concerned about the content? Get in touch with us directly. Alternatively, email editorial-team@simplywallst.com
About NasdaqGM:FLY
Firefly Aerospace
Operates as a space and defense technology company and provides mission solutions for national security, government, and commercial customers.
High growth potential with mediocre balance sheet.
Similar Companies
Market Insights

Advertisement
Community Narratives
The "Molecular Pencil": Why Beam's Technology is Built to Win
Fair Value US$65.01|65.4% undervalued
DA
Community Contributor
The silent giant behind virtually every advanced chip powering AI, smartphones, and modern infrastructure.
Fair Value US$310.00|6.1% undervalued
OS
Community Contributor
ADP Stock: Solid Fundamentals, But AI Investments Test Its Margin Resilience
Fair Value US$387.77|34.2% undervalued
YI
Community Contributor
MINISO's fair value is projected at 26.69 with an anticipated PE ratio shift of 20x
Fair Value US$24.03|9.6% undervalued
BE
Community Contributor