Apex Dynamics, Inc.'s (TWSE:4583) Stock Is Going Strong: Is the Market Following Fundamentals?


Most readers would already be aware that Apex Dynamics' (TWSE:4583) stock increased significantly by 159% over the past three months. Since the market usually pay for a company’s long-term fundamentals, we decided to study the company’s key performance indicators to see if they could be influencing the market. Specifically, we decided to study Apex Dynamics' ROE in this article.
Return on equity or ROE is a key measure used to assess how efficiently a company's management is utilizing the company's capital. Put another way, it reveals the company's success at turning shareholder investments into profits.
Check out our latest analysis for Apex Dynamics
How To Calculate Return On Equity?
ROE can be calculated by using the formula:
Return on Equity = Net Profit (from continuing operations) ÷ Shareholders' Equity
So, based on the above formula, the ROE for Apex Dynamics is:
11% = NT$1.1b ÷ NT$9.7b (Based on the trailing twelve months to June 2024).
The 'return' is the profit over the last twelve months. So, this means that for every NT$1 of its shareholder's investments, the company generates a profit of NT$0.11.
Why Is ROE Important For Earnings Growth?
So far, we've learned that ROE is a measure of a company's profitability. Based on how much of its profits the company chooses to reinvest or "retain", we are then able to evaluate a company's future ability to generate profits. Assuming all else is equal, companies that have both a higher return on equity and higher profit retention are usually the ones that have a higher growth rate when compared to companies that don't have the same features.
Apex Dynamics' Earnings Growth And 11% ROE
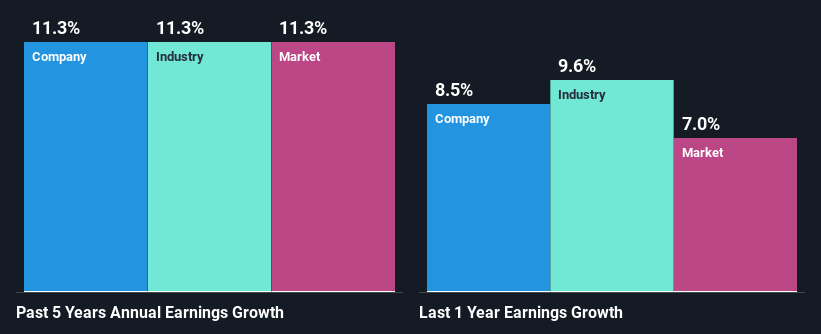
At first glance, Apex Dynamics seems to have a decent ROE. And on comparing with the industry, we found that the the average industry ROE is similar at 11%. This certainly adds some context to Apex Dynamics' moderate 11% net income growth seen over the past five years.
As a next step, we compared Apex Dynamics' net income growth with the industry and found that the company has a similar growth figure when compared with the industry average growth rate of 11% in the same period.
The basis for attaching value to a company is, to a great extent, tied to its earnings growth. It’s important for an investor to know whether the market has priced in the company's expected earnings growth (or decline). Doing so will help them establish if the stock's future looks promising or ominous. If you're wondering about Apex Dynamics''s valuation, check out this gauge of its price-to-earnings ratio, as compared to its industry.
Is Apex Dynamics Using Its Retained Earnings Effectively?
While Apex Dynamics has a three-year median payout ratio of 69% (which means it retains 31% of profits), the company has still seen a fair bit of earnings growth in the past, meaning that its high payout ratio hasn't hampered its ability to grow.
Moreover, Apex Dynamics is determined to keep sharing its profits with shareholders which we infer from its long history of three years of paying a dividend.
Conclusion
In total, we are pretty happy with Apex Dynamics' performance. Especially the high ROE, Which has contributed to the impressive growth seen in earnings. Despite the company reinvesting only a small portion of its profits, it still has managed to grow its earnings so that is appreciable. Until now, we have only just grazed the surface of the company's past performance by looking at the company's fundamentals. To gain further insights into Apex Dynamics' past profit growth, check out this visualization of past earnings, revenue and cash flows.
New: Manage All Your Stock Portfolios in One Place
We've created the ultimate portfolio companion for stock investors, and it's free.
• Connect an unlimited number of Portfolios and see your total in one currency
• Be alerted to new Warning Signs or Risks via email or mobile
• Track the Fair Value of your stocks
Have feedback on this article? Concerned about the content? Get in touch with us directly. Alternatively, email editorial-team (at) simplywallst.com.
This article by Simply Wall St is general in nature. We provide commentary based on historical data and analyst forecasts only using an unbiased methodology and our articles are not intended to be financial advice. It does not constitute a recommendation to buy or sell any stock, and does not take account of your objectives, or your financial situation. We aim to bring you long-term focused analysis driven by fundamental data. Note that our analysis may not factor in the latest price-sensitive company announcements or qualitative material. Simply Wall St has no position in any stocks mentioned.
About TWSE:4583
Apex Dynamics
Engages in the production and sale of robots for plastics injection molding machines in Taiwan, rest of Asia, the Americas, Europe, and internationally.
Flawless balance sheet with acceptable track record.

