
Advertisement
David Iben put it well when he said, 'Volatility is not a risk we care about. What we care about is avoiding the permanent loss of capital.' So it seems the smart money knows that debt - which is usually involved in bankruptcies - is a very important factor, when you assess how risky a company is. We can see that Oceanus Group Limited (SGX:579) does use debt in its business. But the real question is whether this debt is making the company risky.
Why Does Debt Bring Risk?
Debt assists a business until the business has trouble paying it off, either with new capital or with free cash flow. If things get really bad, the lenders can take control of the business. However, a more usual (but still expensive) situation is where a company must dilute shareholders at a cheap share price simply to get debt under control. Of course, plenty of companies use debt to fund growth, without any negative consequences. When we examine debt levels, we first consider both cash and debt levels, together.
How Much Debt Does Oceanus Group Carry?
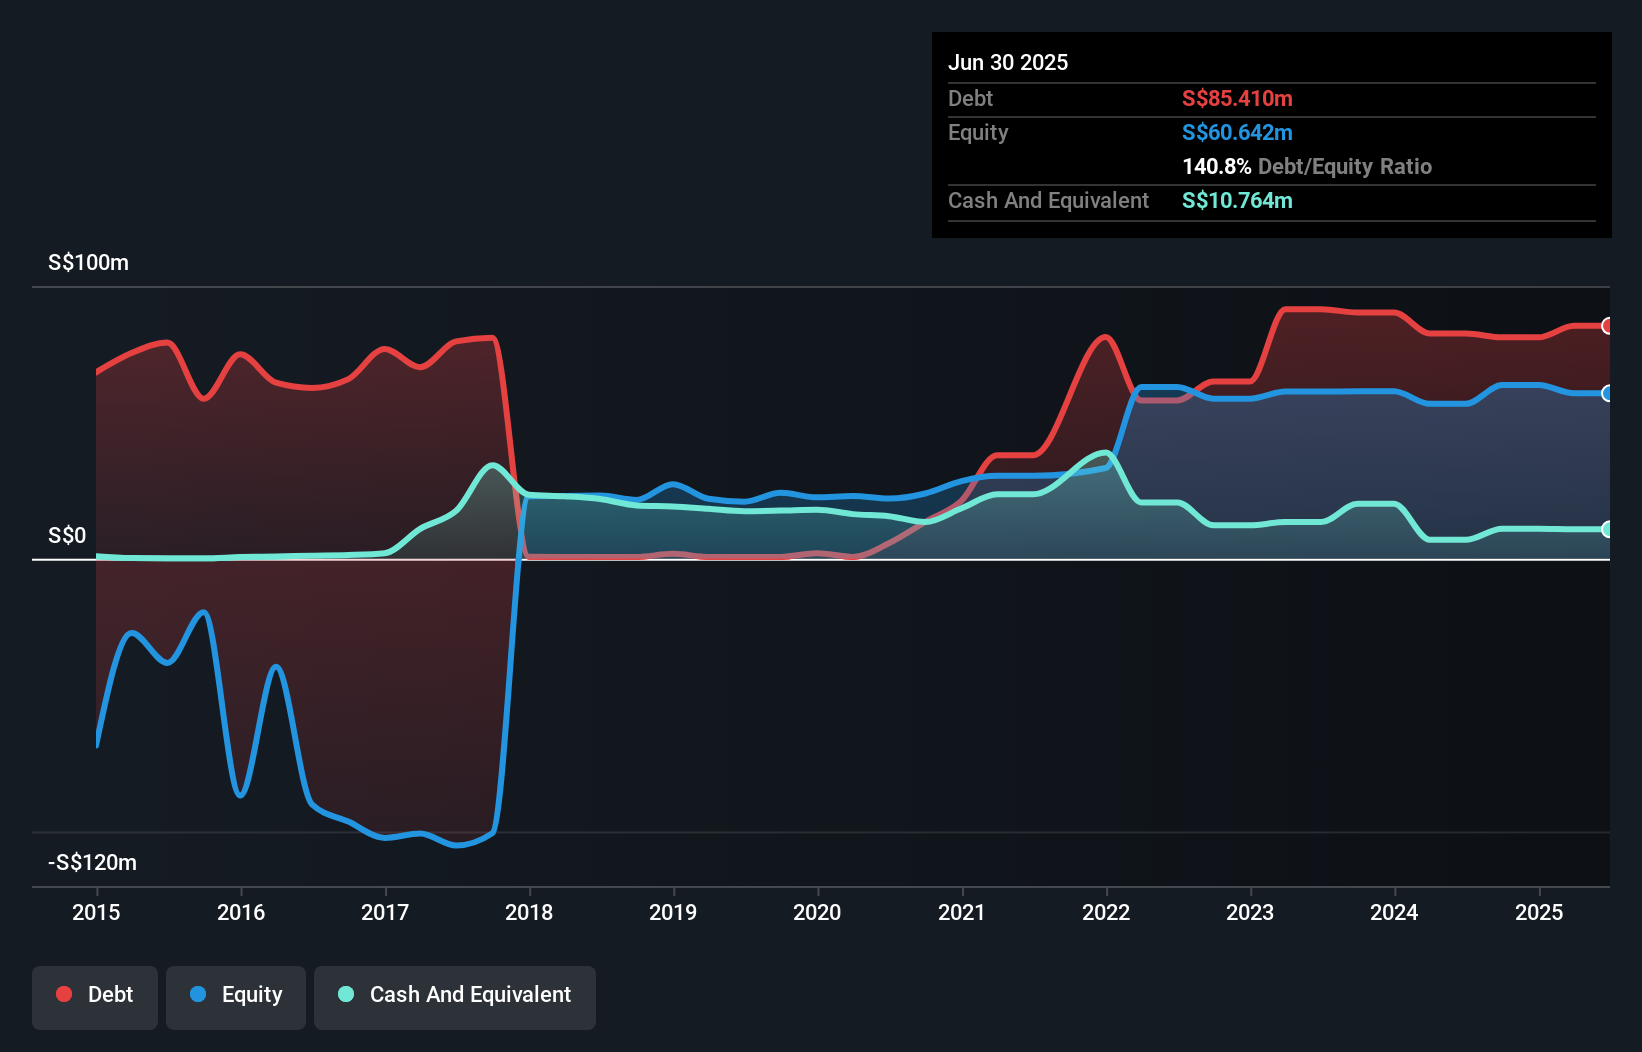
As you can see below, Oceanus Group had S$85.4m of debt, at June 2025, which is about the same as the year before. You can click the chart for greater detail. On the flip side, it has S$10.8m in cash leading to net debt of about S$74.6m.
How Strong Is Oceanus Group's Balance Sheet?
Zooming in on the latest balance sheet data, we can see that Oceanus Group had liabilities of S$109.0m due within 12 months and liabilities of S$4.12m due beyond that. On the other hand, it had cash of S$10.8m and S$97.9m worth of receivables due within a year. So it has liabilities totalling S$4.46m more than its cash and near-term receivables, combined.
Given Oceanus Group has a market capitalization of S$103.1m, it's hard to believe these liabilities pose much threat. However, we do think it is worth keeping an eye on its balance sheet strength, as it may change over time.
See our latest analysis for Oceanus Group
We use two main ratios to inform us about debt levels relative to earnings. The first is net debt divided by earnings before interest, tax, depreciation, and amortization (EBITDA), while the second is how many times its earnings before interest and tax (EBIT) covers its interest expense (or its interest cover, for short). This way, we consider both the absolute quantum of the debt, as well as the interest rates paid on it.
Weak interest cover of 0.97 times and a disturbingly high net debt to EBITDA ratio of 9.4 hit our confidence in Oceanus Group like a one-two punch to the gut. This means we'd consider it to have a heavy debt load. Looking on the bright side, Oceanus Group boosted its EBIT by a silky 62% in the last year. Like the milk of human kindness that sort of growth increases resilience, making the company more capable of managing debt. There's no doubt that we learn most about debt from the balance sheet. But you can't view debt in total isolation; since Oceanus Group will need earnings to service that debt. So if you're keen to discover more about its earnings, it might be worth checking out this graph of its long term earnings trend.
Finally, a business needs free cash flow to pay off debt; accounting profits just don't cut it. So it's worth checking how much of that EBIT is backed by free cash flow. Over the last three years, Oceanus Group saw substantial negative free cash flow, in total. While that may be a result of expenditure for growth, it does make the debt far more risky.
Our View
Oceanus Group's conversion of EBIT to free cash flow and interest cover definitely weigh on it, in our esteem. But the good news is it seems to be able to grow its EBIT with ease. We think that Oceanus Group's debt does make it a bit risky, after considering the aforementioned data points together. That's not necessarily a bad thing, since leverage can boost returns on equity, but it is something to be aware of. When analysing debt levels, the balance sheet is the obvious place to start. However, not all investment risk resides within the balance sheet - far from it. We've identified 4 warning signs with Oceanus Group (at least 2 which are potentially serious) , and understanding them should be part of your investment process.
If you're interested in investing in businesses that can grow profits without the burden of debt, then check out this free list of growing businesses that have net cash on the balance sheet.
New: AI Stock Screener & Alerts
Our new AI Stock Screener scans the market every day to uncover opportunities.
• Dividend Powerhouses (3%+ Yield)
• Undervalued Small Caps with Insider Buying
• High growth Tech and AI Companies
Or build your own from over 50 metrics.
Have feedback on this article? Concerned about the content? Get in touch with us directly. Alternatively, email editorial-team (at) simplywallst.com.
This article by Simply Wall St is general in nature. We provide commentary based on historical data and analyst forecasts only using an unbiased methodology and our articles are not intended to be financial advice. It does not constitute a recommendation to buy or sell any stock, and does not take account of your objectives, or your financial situation. We aim to bring you long-term focused analysis driven by fundamental data. Note that our analysis may not factor in the latest price-sensitive company announcements or qualitative material. Simply Wall St has no position in any stocks mentioned.
About SGX:579
Oceanus Group
An investment holding company, sells processed marine products, sugar, beverages, and other commodities in the People’s Republic of China, Hong Kong, Macau, Singapore, and Thailand.
Slight risk with questionable track record.
Market Insights

Advertisement
Community Narratives
The "Molecular Pencil": Why Beam's Technology is Built to Win
Fair Value US$65.01|65.4% undervalued
DA
Community Contributor
The silent giant behind virtually every advanced chip powering AI, smartphones, and modern infrastructure.
Fair Value US$310.00|6.1% undervalued
OS
Community Contributor
ADP Stock: Solid Fundamentals, But AI Investments Test Its Margin Resilience
Fair Value US$387.77|34.2% undervalued
YI
Community Contributor
MINISO's fair value is projected at 26.69 with an anticipated PE ratio shift of 20x
Fair Value US$24.03|9.6% undervalued
BE
Community Contributor