Advertisement
Cloetta (OM:CLA B): Assessing Valuation Following Robust Profit Growth in Latest Earnings

Simply Wall St
Reviewed by Simply Wall St
Cloetta (OM:CLA B) just released its third quarter results, revealing that despite slightly lower sales compared to last year, the company’s net income and earnings per share have climbed. This signals improved profitability and is likely drawing investor interest.
See our latest analysis for Cloetta.
Cloetta’s solid profit growth this quarter arrives as momentum is clearly building in its share price, with a 37% share price return year-to-date and the stock now at SEK 34.86. Over the past year, total shareholder return stands at 39.85%, and long-term holders have seen a 93% total return over three years. These figures reflect increasing confidence in the company’s ability to deliver results, even in the face of modest top-line growth.
If you’re curious what other companies are delivering strong performance, now is a great time to broaden your perspective and discover fast growing stocks with high insider ownership
With shares riding high on robust earnings, the key question now is whether Cloetta remains undervalued or if the current share price already reflects expectations for future growth. Could there still be a buying opportunity?
Price-to-Earnings of 14x: Is it justified?
At SEK 34.86, Cloetta is trading at a price-to-earnings (P/E) ratio of 14, positioning it as attractively valued compared with peers and its own fair value estimates.
The P/E ratio measures how much investors are willing to pay for one unit of earnings. It is a commonly used benchmark for comparing a company’s valuation within the food sector. For established, steady-growth businesses like Cloetta, the P/E ratio helps signal whether the market is pricing in too much optimism or leaving room for upside.
Currently, Cloetta’s P/E of 14 is more favorable than both the peer average (25.7x) and the broader European Food industry average (15.5x). Additionally, it closely matches the estimated Fair Price-To-Earnings Ratio of 14.1x. This suggests the market price could be in line with fundamental value and may have further room to run if profit momentum continues.
Explore the SWS fair ratio for Cloetta
Result: Price-to-Earnings of 14 (UNDERVALUED)
However, slower annual revenue growth and recent declines in net income highlight uncertainties that could present challenges to Cloetta’s ongoing profitability and share price momentum.
Find out about the key risks to this Cloetta narrative.
Another View: How Does the SWS DCF Model Compare?
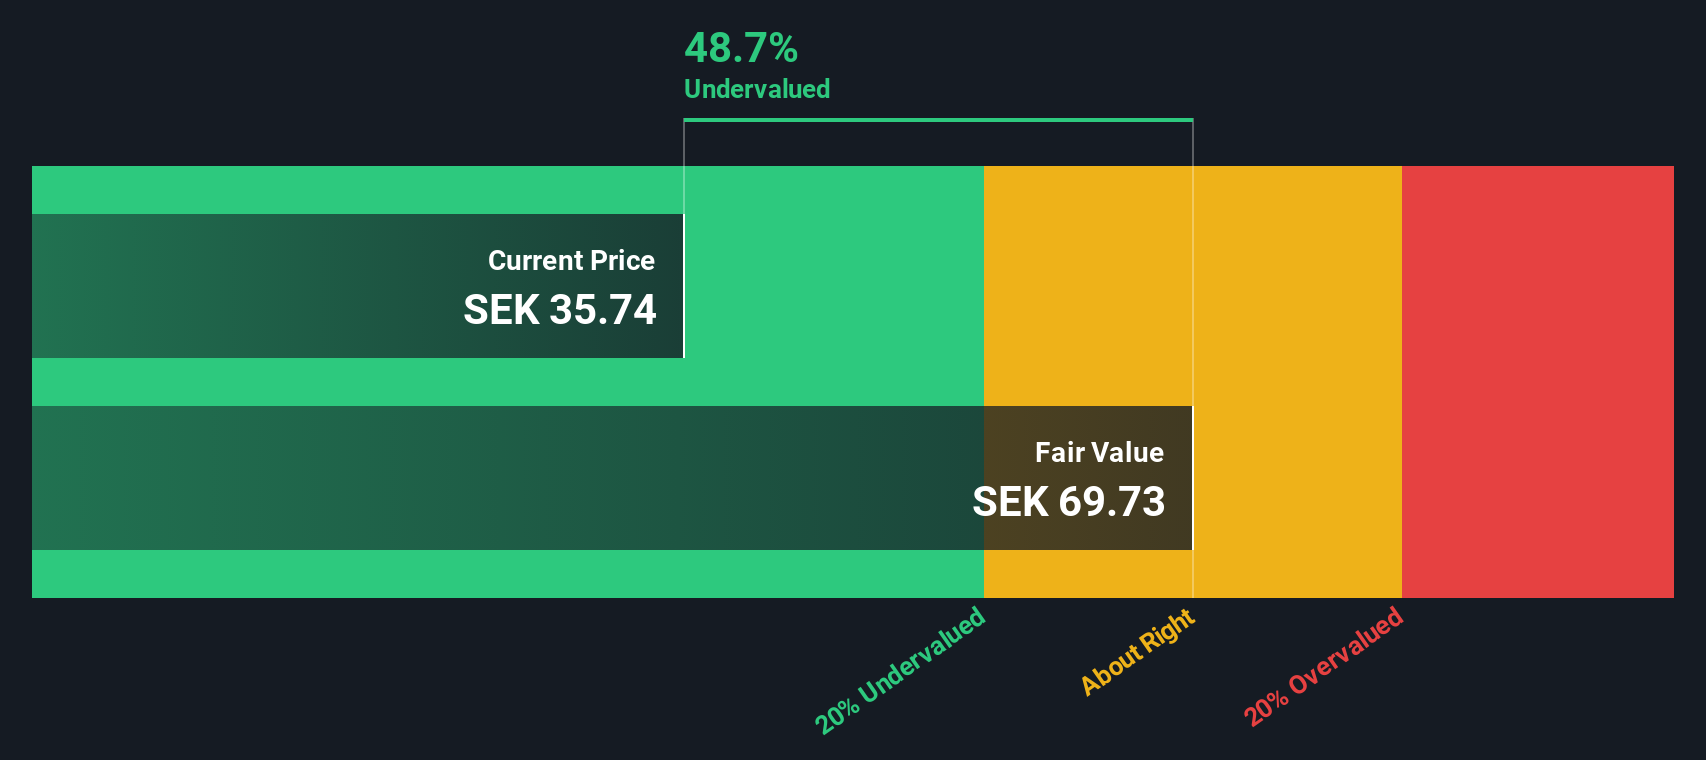
Looking past the price-to-earnings ratio, the SWS DCF model, which estimates fair value based on future cash flows, suggests a very different picture. According to this approach, Cloetta could be undervalued by as much as 40 percent compared to its estimated fair value. Could the market be missing a bigger opportunity here?
Look into how the SWS DCF model arrives at its fair value.
Simply Wall St performs a discounted cash flow (DCF) on every stock in the world every day (check out Cloetta for example). We show the entire calculation in full. You can track the result in your watchlist or portfolio and be alerted when this changes, or use our stock screener to discover 884 undervalued stocks based on their cash flows. If you save a screener we even alert you when new companies match - so you never miss a potential opportunity.
Build Your Own Cloetta Narrative
If you'd rather look at the numbers your own way or want to explore an alternative angle, it takes just a few minutes to craft your own perspective. Do it your way
A great starting point for your Cloetta research is our analysis highlighting 3 key rewards and 2 important warning signs that could impact your investment decision.
Looking for more investment ideas?
You work hard for your money. Make it work just as hard for you. Don’t let the best market opportunities pass you by when Simply Wall Street offers powerful screeners for every type of investor.
- Jump on long-term potential by checking out these 884 undervalued stocks based on cash flows, packed with companies trading under their true worth according to cash flows and market sentiment.
- Start building reliable income streams when you use these 14 dividend stocks with yields > 3%, featuring stocks with yields greater than 3% for those who value both growth and steady returns.
- Catch the next wave of tech disruption by browsing these 27 AI penny stocks, where innovation meets opportunity in artificial intelligence and tomorrow’s tech leaders emerge.
This article by Simply Wall St is general in nature. We provide commentary based on historical data and analyst forecasts only using an unbiased methodology and our articles are not intended to be financial advice. It does not constitute a recommendation to buy or sell any stock, and does not take account of your objectives, or your financial situation. We aim to bring you long-term focused analysis driven by fundamental data. Note that our analysis may not factor in the latest price-sensitive company announcements or qualitative material. Simply Wall St has no position in any stocks mentioned.
New: AI Stock Screener & Alerts
Our new AI Stock Screener scans the market every day to uncover opportunities.
• Dividend Powerhouses (3%+ Yield)
• Undervalued Small Caps with Insider Buying
• High growth Tech and AI Companies
Or build your own from over 50 metrics.
Have feedback on this article? Concerned about the content? Get in touch with us directly. Alternatively, email editorial-team@simplywallst.com
About OM:CLA B
Flawless balance sheet, undervalued and pays a dividend.
Similar Companies
Market Insights

Advertisement
Community Narratives
MINISO's fair value is projected at 26.69 with an anticipated PE ratio shift of 20x
Fair Value US$24.03|11.4% undervalued
BE
Community Contributor
Procter & Gamble: A Dividend Giant Facing Slowing Growth
Fair Value US$119.81|23.5% overvalued
AN
Community Contributor
Eli Lilly's Future Growth Driven by Tirzepatide and Favorable Market Conditions
Fair Value US$1.19k|14.0% undervalued
EA
Community Contributor