- Saudi Arabia
- /
- Basic Materials
- /
- SASE:3008
Al Kathiri Holding (TADAWUL:3008) shareholder returns have been solid, earning 179% in 5 years

Stock pickers are generally looking for stocks that will outperform the broader market. And in our experience, buying the right stocks can give your wealth a significant boost. For example, the Al Kathiri Holding Company (TADAWUL:3008) share price is up 48% in the last 5 years, clearly besting the market return of around 12% (ignoring dividends).
Since the stock has added ر.س70m to its market cap in the past week alone, let's see if underlying performance has been driving long-term returns.
View our latest analysis for Al Kathiri Holding
To quote Buffett, 'Ships will sail around the world but the Flat Earth Society will flourish. There will continue to be wide discrepancies between price and value in the marketplace...' One flawed but reasonable way to assess how sentiment around a company has changed is to compare the earnings per share (EPS) with the share price.
Al Kathiri Holding's earnings per share are down 50% per year, despite strong share price performance over five years.
This means it's unlikely the market is judging the company based on earnings growth. Because earnings per share don't seem to match up with the share price, we'll take a look at other metrics instead.
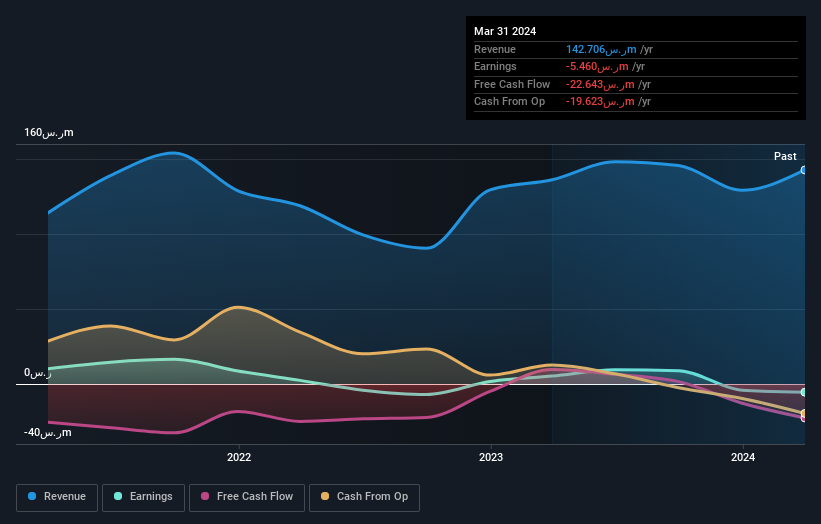
In contrast revenue growth of 13% per year is probably viewed as evidence that Al Kathiri Holding is growing, a real positive. It's quite possible that management are prioritizing revenue growth over EPS growth at the moment.
You can see how earnings and revenue have changed over time in the image below (click on the chart to see the exact values).
If you are thinking of buying or selling Al Kathiri Holding stock, you should check out this FREE detailed report on its balance sheet.
What About The Total Shareholder Return (TSR)?
Investors should note that there's a difference between Al Kathiri Holding's total shareholder return (TSR) and its share price change, which we've covered above. The TSR attempts to capture the value of dividends (as if they were reinvested) as well as any spin-offs or discounted capital raisings offered to shareholders. We note that Al Kathiri Holding's TSR, at 179% is higher than its share price return of 48%. When you consider it hasn't been paying a dividend, this data suggests shareholders have benefitted from a spin-off, or had the opportunity to acquire attractively priced shares in a discounted capital raising.
A Different Perspective
While the broader market lost about 4.1% in the twelve months, Al Kathiri Holding shareholders did even worse, losing 7.7%. However, it could simply be that the share price has been impacted by broader market jitters. It might be worth keeping an eye on the fundamentals, in case there's a good opportunity. On the bright side, long term shareholders have made money, with a gain of 23% per year over half a decade. If the fundamental data continues to indicate long term sustainable growth, the current sell-off could be an opportunity worth considering. I find it very interesting to look at share price over the long term as a proxy for business performance. But to truly gain insight, we need to consider other information, too. To that end, you should be aware of the 2 warning signs we've spotted with Al Kathiri Holding .
If you would prefer to check out another company -- one with potentially superior financials -- then do not miss this free list of companies that have proven they can grow earnings.
Please note, the market returns quoted in this article reflect the market weighted average returns of stocks that currently trade on Saudi exchanges.
New: Manage All Your Stock Portfolios in One Place
We've created the ultimate portfolio companion for stock investors, and it's free.
• Connect an unlimited number of Portfolios and see your total in one currency
• Be alerted to new Warning Signs or Risks via email or mobile
• Track the Fair Value of your stocks
Have feedback on this article? Concerned about the content? Get in touch with us directly. Alternatively, email editorial-team (at) simplywallst.com.
This article by Simply Wall St is general in nature. We provide commentary based on historical data and analyst forecasts only using an unbiased methodology and our articles are not intended to be financial advice. It does not constitute a recommendation to buy or sell any stock, and does not take account of your objectives, or your financial situation. We aim to bring you long-term focused analysis driven by fundamental data. Note that our analysis may not factor in the latest price-sensitive company announcements or qualitative material. Simply Wall St has no position in any stocks mentioned.
Have feedback on this article? Concerned about the content? Get in touch with us directly. Alternatively, email editorial-team@simplywallst.com
About SASE:3008
Al Kathiri Holding
Manufactures, distributes, and transports cement and ready-made concrete to construction and real estate development companies in the Kingdom of Saudi Arabia.
Imperfect balance sheet very low.

