- Saudi Arabia
- /
- Healthcare Services
- /
- SASE:4005
National Medical Care's (TADAWUL:4005) 31% CAGR outpaced the company's earnings growth over the same five-year period


The worst result, after buying shares in a company (assuming no leverage), would be if you lose all the money you put in. But on a lighter note, a good company can see its share price rise well over 100%. For example, the National Medical Care Company (TADAWUL:4005) share price has soared 243% in the last half decade. Most would be very happy with that. And in the last week the share price has popped 4.2%.
Since the stock has added ر.س368m to its market cap in the past week alone, let's see if underlying performance has been driving long-term returns.
See our latest analysis for National Medical Care
In his essay The Superinvestors of Graham-and-Doddsville Warren Buffett described how share prices do not always rationally reflect the value of a business. By comparing earnings per share (EPS) and share price changes over time, we can get a feel for how investor attitudes to a company have morphed over time.
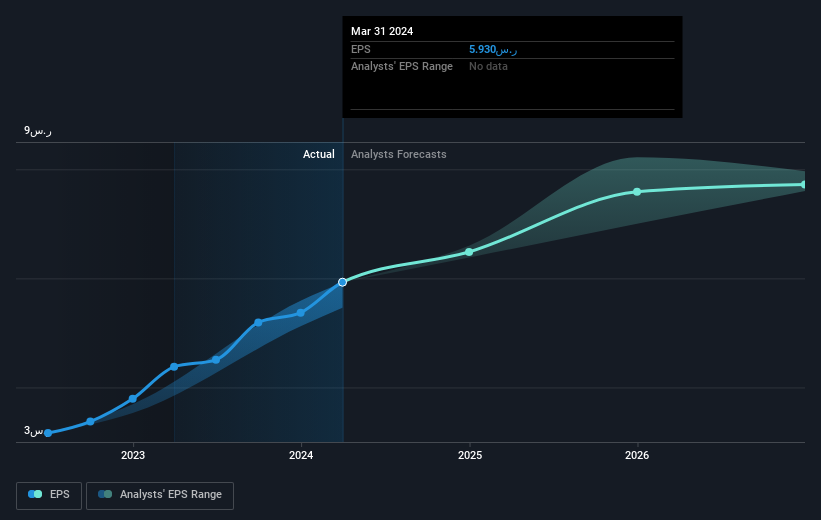
During five years of share price growth, National Medical Care achieved compound earnings per share (EPS) growth of 32% per year. So the EPS growth rate is rather close to the annualized share price gain of 28% per year. This indicates that investor sentiment towards the company has not changed a great deal. Indeed, it would appear the share price is reacting to the EPS.
The graphic below depicts how EPS has changed over time (unveil the exact values by clicking on the image).
It is of course excellent to see how National Medical Care has grown profits over the years, but the future is more important for shareholders. It might be well worthwhile taking a look at our free report on how its financial position has changed over time.
What About Dividends?
When looking at investment returns, it is important to consider the difference between total shareholder return (TSR) and share price return. Whereas the share price return only reflects the change in the share price, the TSR includes the value of dividends (assuming they were reinvested) and the benefit of any discounted capital raising or spin-off. Arguably, the TSR gives a more comprehensive picture of the return generated by a stock. As it happens, National Medical Care's TSR for the last 5 years was 280%, which exceeds the share price return mentioned earlier. The dividends paid by the company have thusly boosted the total shareholder return.
A Different Perspective
It's good to see that National Medical Care has rewarded shareholders with a total shareholder return of 65% in the last twelve months. Of course, that includes the dividend. That's better than the annualised return of 31% over half a decade, implying that the company is doing better recently. In the best case scenario, this may hint at some real business momentum, implying that now could be a great time to delve deeper. Is National Medical Care cheap compared to other companies? These 3 valuation measures might help you decide.
If you like to buy stocks alongside management, then you might just love this free list of companies. (Hint: many of them are unnoticed AND have attractive valuation).
Please note, the market returns quoted in this article reflect the market weighted average returns of stocks that currently trade on Saudi exchanges.
Valuation is complex, but we're here to simplify it.
Discover if National Medical Care might be undervalued or overvalued with our detailed analysis, featuring fair value estimates, potential risks, dividends, insider trades, and its financial condition.
Access Free AnalysisHave feedback on this article? Concerned about the content? Get in touch with us directly. Alternatively, email editorial-team (at) simplywallst.com.
This article by Simply Wall St is general in nature. We provide commentary based on historical data and analyst forecasts only using an unbiased methodology and our articles are not intended to be financial advice. It does not constitute a recommendation to buy or sell any stock, and does not take account of your objectives, or your financial situation. We aim to bring you long-term focused analysis driven by fundamental data. Note that our analysis may not factor in the latest price-sensitive company announcements or qualitative material. Simply Wall St has no position in any stocks mentioned.
About SASE:4005
National Medical Care
National Medical Care Company establishes, own, equips, manages, maintains, and operates healthcare facilities in the Kingdom of Saudi Arabia.
Excellent balance sheet with proven track record.

