
Advertisement
- Saudi Arabia
- /
- Food
- /
- SASE:2050
1,079% earnings growth over 1 year has not materialized into gains for Savola Group (TADAWUL:2050) shareholders over that period

The simplest way to benefit from a rising market is to buy an index fund. When you buy individual stocks, you can make higher profits, but you also face the risk of under-performance. For example, the Savola Group Company (TADAWUL:2050) share price is down 86% in the last year. That contrasts poorly with the market decline of 9.0%. We note that it has not been easy for shareholders over three years, either; the share price is down 79% in that time. The falls have accelerated recently, with the share price down 13% in the last three months. But this could be related to the weak market, which is down 5.1% in the same period. While a drop like that is definitely a body blow, money isn't as important as health and happiness.
Since Savola Group has shed ر.س317m from its value in the past 7 days, let's see if the longer term decline has been driven by the business' economics.
To paraphrase Benjamin Graham: Over the short term the market is a voting machine, but over the long term it's a weighing machine. One flawed but reasonable way to assess how sentiment around a company has changed is to compare the earnings per share (EPS) with the share price.
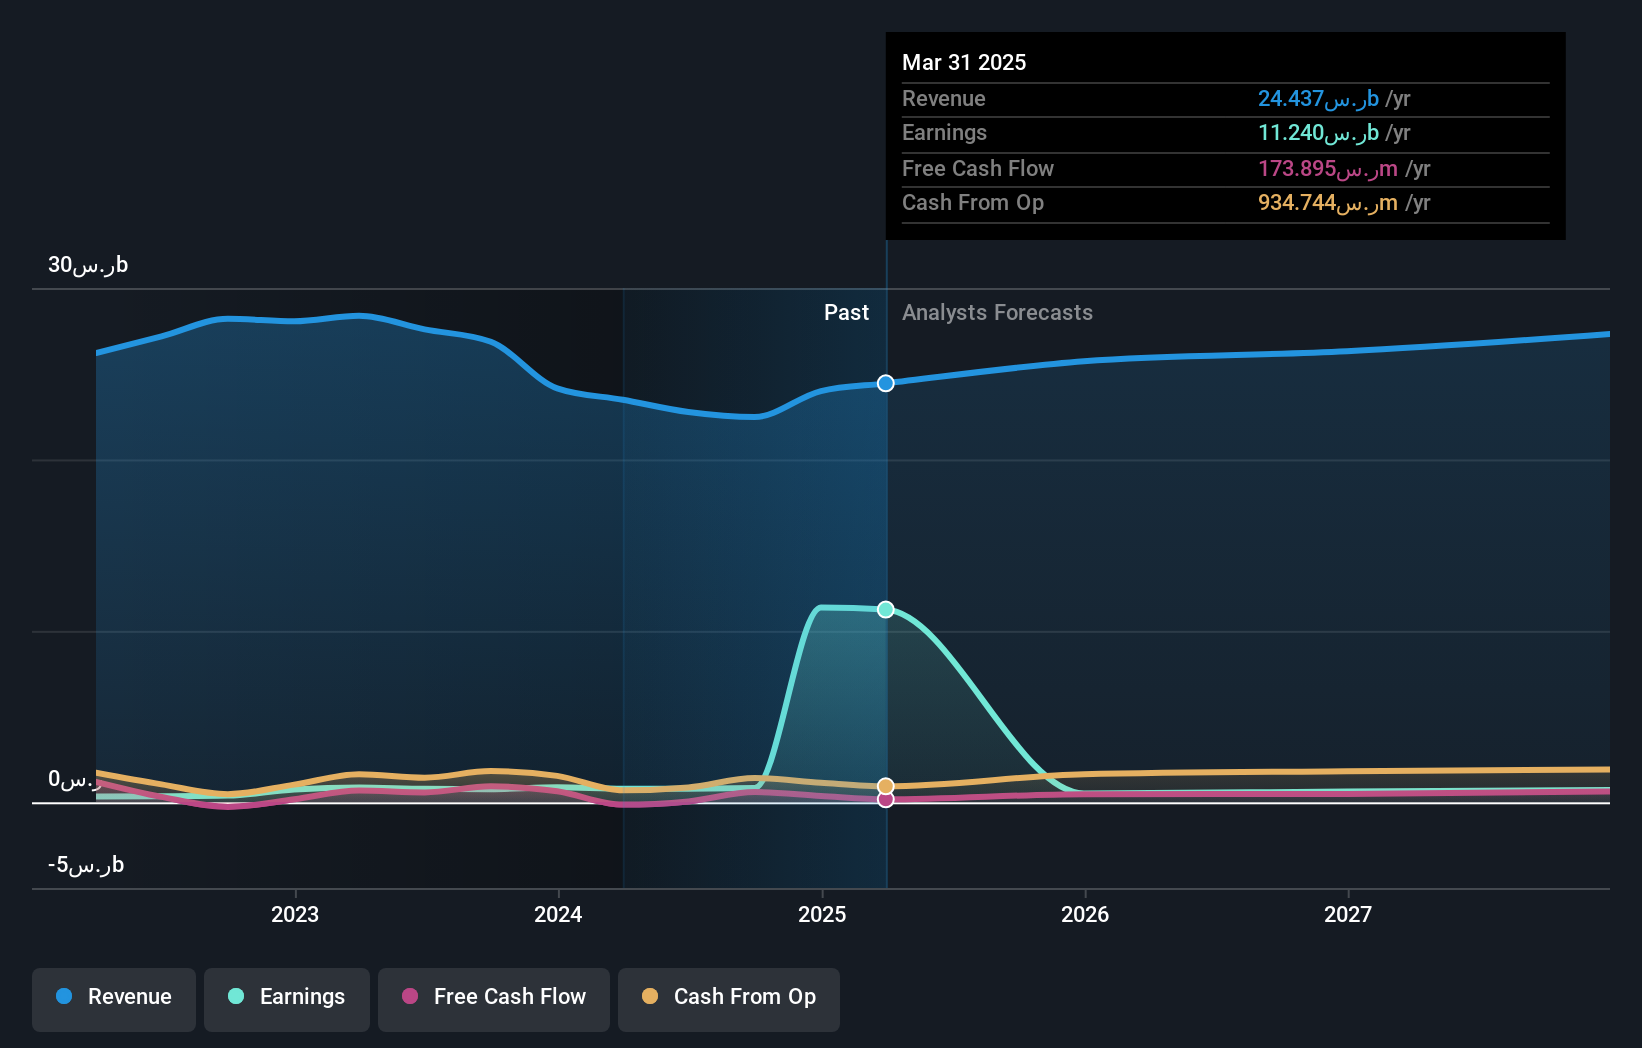
During the last year Savola Group saw its earnings per share increase strongly. The rate of growth may not be sustainable, but it is still really positive. As you can imagine, the share price action therefore perturbs us. So it's worth taking a look at some other metrics.
Savola Group's revenue is actually up 4.1% over the last year. Since we can't easily explain the share price movement based on these metrics, it might be worth considering how market sentiment has changed towards the stock.
You can see below how earnings and revenue have changed over time (discover the exact values by clicking on the image).
It is of course excellent to see how Savola Group has grown profits over the years, but the future is more important for shareholders. If you are thinking of buying or selling Savola Group stock, you should check out this FREE detailed report on its balance sheet.
What About The Total Shareholder Return (TSR)?
We've already covered Savola Group's share price action, but we should also mention its total shareholder return (TSR). The TSR is a return calculation that accounts for the value of cash dividends (assuming that any dividend received was reinvested) and the calculated value of any discounted capital raisings and spin-offs. Dividends have been really beneficial for Savola Group shareholders, and that cash payout explains why its total shareholder loss of 16%, over the last 1 year, isn't as bad as the share price return.
A Different Perspective
While the broader market lost about 9.0% in the twelve months, Savola Group shareholders did even worse, losing 16%. However, it could simply be that the share price has been impacted by broader market jitters. It might be worth keeping an eye on the fundamentals, in case there's a good opportunity. Regrettably, last year's performance caps off a bad run, with the shareholders facing a total loss of 1.7% per year over five years. Generally speaking long term share price weakness can be a bad sign, though contrarian investors might want to research the stock in hope of a turnaround. I find it very interesting to look at share price over the long term as a proxy for business performance. But to truly gain insight, we need to consider other information, too. Consider for instance, the ever-present spectre of investment risk. We've identified 3 warning signs with Savola Group , and understanding them should be part of your investment process.
Of course Savola Group may not be the best stock to buy. So you may wish to see this free collection of growth stocks.
Please note, the market returns quoted in this article reflect the market weighted average returns of stocks that currently trade on Saudi exchanges.
New: Manage All Your Stock Portfolios in One Place
We've created the ultimate portfolio companion for stock investors, and it's free.
• Connect an unlimited number of Portfolios and see your total in one currency
• Be alerted to new Warning Signs or Risks via email or mobile
• Track the Fair Value of your stocks
Have feedback on this article? Concerned about the content? Get in touch with us directly. Alternatively, email editorial-team (at) simplywallst.com.
This article by Simply Wall St is general in nature. We provide commentary based on historical data and analyst forecasts only using an unbiased methodology and our articles are not intended to be financial advice. It does not constitute a recommendation to buy or sell any stock, and does not take account of your objectives, or your financial situation. We aim to bring you long-term focused analysis driven by fundamental data. Note that our analysis may not factor in the latest price-sensitive company announcements or qualitative material. Simply Wall St has no position in any stocks mentioned.
About SASE:2050
Undervalued with solid track record.
Market Insights

Advertisement
Community Narratives
MicroStrategy: Volatile Gamble or Golden Opportunity?
Fair Value US$663.00|31.9% undervalued
BL
Community Contributor
Emerging Markets and Debt Reduction Will Propel Bath & Body Works Forward
Fair Value US$40.73|22.1% undervalued
ZW
Community Contributor
An amazing opportunity to potentially get a 100 bagger
Fair Value US$10.00|36.0% overvalued
DA
Community Contributor