- Saudi Arabia
- /
- Oil and Gas
- /
- SASE:2222
Saudi Arabian Oil Company's (TADAWUL:2222) Stock Has Shown Weakness Lately But Financial Prospects Look Decent: Is The Market Wrong?


Saudi Arabian Oil (TADAWUL:2222) has had a rough three months with its share price down 7.9%. But if you pay close attention, you might find that its key financial indicators look quite decent, which could mean that the stock could potentially rise in the long-term given how markets usually reward more resilient long-term fundamentals. In this article, we decided to focus on Saudi Arabian Oil's ROE.
Return on equity or ROE is a key measure used to assess how efficiently a company's management is utilizing the company's capital. In simpler terms, it measures the profitability of a company in relation to shareholder's equity.
Check out our latest analysis for Saudi Arabian Oil
How To Calculate Return On Equity?
The formula for ROE is:
Return on Equity = Net Profit (from continuing operations) ÷ Shareholders' Equity
So, based on the above formula, the ROE for Saudi Arabian Oil is:
25% = ر.س437b ÷ ر.س1.7t (Based on the trailing twelve months to March 2024).
The 'return' is the income the business earned over the last year. Another way to think of that is that for every SAR1 worth of equity, the company was able to earn SAR0.25 in profit.
What Is The Relationship Between ROE And Earnings Growth?
So far, we've learned that ROE is a measure of a company's profitability. Depending on how much of these profits the company reinvests or "retains", and how effectively it does so, we are then able to assess a company’s earnings growth potential. Assuming everything else remains unchanged, the higher the ROE and profit retention, the higher the growth rate of a company compared to companies that don't necessarily bear these characteristics.
Saudi Arabian Oil's Earnings Growth And 25% ROE
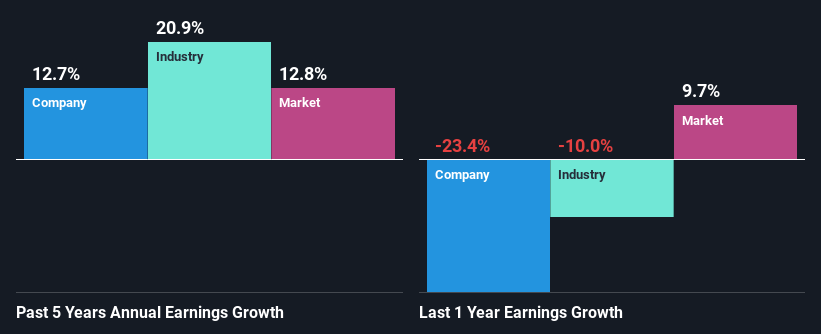
To begin with, Saudi Arabian Oil seems to have a respectable ROE. Especially when compared to the industry average of 11% the company's ROE looks pretty impressive. This probably laid the ground for Saudi Arabian Oil's moderate 13% net income growth seen over the past five years.
As a next step, we compared Saudi Arabian Oil's net income growth with the industry and were disappointed to see that the company's growth is lower than the industry average growth of 21% in the same period.
Earnings growth is a huge factor in stock valuation. The investor should try to establish if the expected growth or decline in earnings, whichever the case may be, is priced in. This then helps them determine if the stock is placed for a bright or bleak future. If you're wondering about Saudi Arabian Oil's's valuation, check out this gauge of its price-to-earnings ratio, as compared to its industry.
Is Saudi Arabian Oil Using Its Retained Earnings Effectively?
The high three-year median payout ratio of 71% (or a retention ratio of 29%) for Saudi Arabian Oil suggests that the company's growth wasn't really hampered despite it returning most of its income to its shareholders.
Additionally, Saudi Arabian Oil has paid dividends over a period of four years which means that the company is pretty serious about sharing its profits with shareholders. Upon studying the latest analysts' consensus data, we found that the company's future payout ratio is expected to rise to 89% over the next three years. Regardless, the ROE is not expected to change much for the company despite the higher expected payout ratio.
Summary
On the whole, we do feel that Saudi Arabian Oil has some positive attributes. Its earnings growth is decent, and the high ROE does contribute to that growth. However, investors could have benefitted even more from the high ROE, had the company been reinvesting more of its earnings. With that said, the latest industry analyst forecasts reveal that the company's earnings growth is expected to slow down. To know more about the latest analysts predictions for the company, check out this visualization of analyst forecasts for the company.
New: Manage All Your Stock Portfolios in One Place
We've created the ultimate portfolio companion for stock investors, and it's free.
• Connect an unlimited number of Portfolios and see your total in one currency
• Be alerted to new Warning Signs or Risks via email or mobile
• Track the Fair Value of your stocks
Have feedback on this article? Concerned about the content? Get in touch with us directly. Alternatively, email editorial-team (at) simplywallst.com.
This article by Simply Wall St is general in nature. We provide commentary based on historical data and analyst forecasts only using an unbiased methodology and our articles are not intended to be financial advice. It does not constitute a recommendation to buy or sell any stock, and does not take account of your objectives, or your financial situation. We aim to bring you long-term focused analysis driven by fundamental data. Note that our analysis may not factor in the latest price-sensitive company announcements or qualitative material. Simply Wall St has no position in any stocks mentioned.
Have feedback on this article? Concerned about the content? Get in touch with us directly. Alternatively, email editorial-team@simplywallst.com
About SASE:2222
Saudi Arabian Oil
Operates as an integrated energy and chemical company in the Kingdom of Saudi Arabia and internationally.
Flawless balance sheet with acceptable track record.

