Sevenet S.A.'s (WSE:SEV) Fundamentals Look Pretty Strong: Could The Market Be Wrong About The Stock?


With its stock down 12% over the past week, it is easy to disregard Sevenet (WSE:SEV). But if you pay close attention, you might find that its key financial indicators look quite decent, which could mean that the stock could potentially rise in the long-term given how markets usually reward more resilient long-term fundamentals. Particularly, we will be paying attention to Sevenet's ROE today.
Return on Equity or ROE is a test of how effectively a company is growing its value and managing investors’ money. In short, ROE shows the profit each dollar generates with respect to its shareholder investments.
Check out our latest analysis for Sevenet
How Is ROE Calculated?
The formula for ROE is:
Return on Equity = Net Profit (from continuing operations) ÷ Shareholders' Equity
So, based on the above formula, the ROE for Sevenet is:
13% = zł2.4m ÷ zł19m (Based on the trailing twelve months to June 2024).
The 'return' is the income the business earned over the last year. That means that for every PLN1 worth of shareholders' equity, the company generated PLN0.13 in profit.
Why Is ROE Important For Earnings Growth?
So far, we've learned that ROE is a measure of a company's profitability. Depending on how much of these profits the company reinvests or "retains", and how effectively it does so, we are then able to assess a company’s earnings growth potential. Assuming everything else remains unchanged, the higher the ROE and profit retention, the higher the growth rate of a company compared to companies that don't necessarily bear these characteristics.
A Side By Side comparison of Sevenet's Earnings Growth And 13% ROE
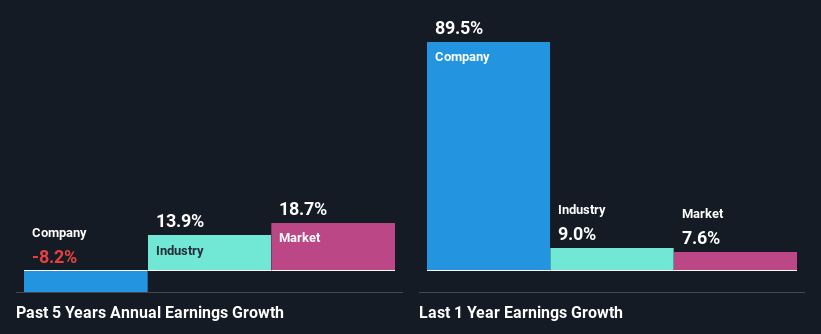
At first glance, Sevenet seems to have a decent ROE. Even when compared to the industry average of 12% the company's ROE looks quite decent. However, while Sevenet has a pretty respectable ROE, its five year net income decline rate was 8.2% . Based on this, we feel that there might be other reasons which haven't been discussed so far in this article that could be hampering the company's growth. These include low earnings retention or poor allocation of capital.
So, as a next step, we compared Sevenet's performance against the industry and were disappointed to discover that while the company has been shrinking its earnings, the industry has been growing its earnings at a rate of 14% over the last few years.
Earnings growth is an important metric to consider when valuing a stock. The investor should try to establish if the expected growth or decline in earnings, whichever the case may be, is priced in. By doing so, they will have an idea if the stock is headed into clear blue waters or if swampy waters await. Is Sevenet fairly valued compared to other companies? These 3 valuation measures might help you decide.
Is Sevenet Making Efficient Use Of Its Profits?
Sevenet has a high three-year median payout ratio of 76% (that is, it is retaining 24% of its profits). This suggests that the company is paying most of its profits as dividends to its shareholders. This goes some way in explaining why its earnings have been shrinking. The business is only left with a small pool of capital to reinvest - A vicious cycle that doesn't benefit the company in the long-run. Our risks dashboard should have the 4 risks we have identified for Sevenet.
Moreover, Sevenet has been paying dividends for three years, which is a considerable amount of time, suggesting that management must have perceived that the shareholders prefer consistent dividends even though earnings have been shrinking.
Conclusion
On the whole, we do feel that Sevenet has some positive attributes. However, while the company does have a high ROE, its earnings growth number is quite disappointing. This can be blamed on the fact that it reinvests only a small portion of its profits and pays out the rest as dividends. Up till now, we've only made a short study of the company's growth data. You can do your own research on Sevenet and see how it has performed in the past by looking at this FREE detailed graph of past earnings, revenue and cash flows.
New: Manage All Your Stock Portfolios in One Place
We've created the ultimate portfolio companion for stock investors, and it's free.
• Connect an unlimited number of Portfolios and see your total in one currency
• Be alerted to new Warning Signs or Risks via email or mobile
• Track the Fair Value of your stocks
Have feedback on this article? Concerned about the content? Get in touch with us directly. Alternatively, email editorial-team (at) simplywallst.com.
This article by Simply Wall St is general in nature. We provide commentary based on historical data and analyst forecasts only using an unbiased methodology and our articles are not intended to be financial advice. It does not constitute a recommendation to buy or sell any stock, and does not take account of your objectives, or your financial situation. We aim to bring you long-term focused analysis driven by fundamental data. Note that our analysis may not factor in the latest price-sensitive company announcements or qualitative material. Simply Wall St has no position in any stocks mentioned.
About WSE:SEV
Sevenet
An IT company, provides ICT solutions for enterprises and institutions primarily in Poland.
Proven track record with adequate balance sheet.

