- South Korea
- /
- Electronic Equipment and Components
- /
- KOSE:A009150
Investors in Samsung Electro-Mechanics (KRX:009150) have seen decent returns of 69% over the past five years


Stock pickers are generally looking for stocks that will outperform the broader market. And while active stock picking involves risks (and requires diversification) it can also provide excess returns. For example, long term Samsung Electro-Mechanics Co., Ltd. (KRX:009150) shareholders have enjoyed a 60% share price rise over the last half decade, well in excess of the market return of around 33% (not including dividends). However, more recent returns haven't been as impressive as that, with the stock returning just 2.1% in the last year, including dividends.
So let's investigate and see if the longer term performance of the company has been in line with the underlying business' progress.
See our latest analysis for Samsung Electro-Mechanics
To paraphrase Benjamin Graham: Over the short term the market is a voting machine, but over the long term it's a weighing machine. One flawed but reasonable way to assess how sentiment around a company has changed is to compare the earnings per share (EPS) with the share price.
Samsung Electro-Mechanics' earnings per share are down 10% per year, despite strong share price performance over five years.
This means it's unlikely the market is judging the company based on earnings growth. Since the change in EPS doesn't seem to correlate with the change in share price, it's worth taking a look at other metrics.
The modest 0.8% dividend yield is unlikely to be propping up the share price. On the other hand, Samsung Electro-Mechanics' revenue is growing nicely, at a compound rate of 4.1% over the last five years. In that case, the company may be sacrificing current earnings per share to drive growth.
You can see how earnings and revenue have changed over time in the image below (click on the chart to see the exact values).
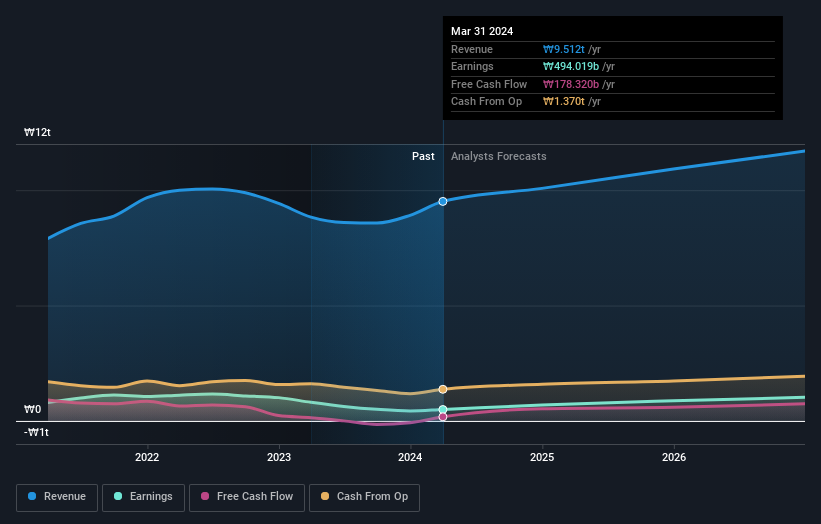
Samsung Electro-Mechanics is a well known stock, with plenty of analyst coverage, suggesting some visibility into future growth. So it makes a lot of sense to check out what analysts think Samsung Electro-Mechanics will earn in the future (free analyst consensus estimates)
What About Dividends?
It is important to consider the total shareholder return, as well as the share price return, for any given stock. Whereas the share price return only reflects the change in the share price, the TSR includes the value of dividends (assuming they were reinvested) and the benefit of any discounted capital raising or spin-off. Arguably, the TSR gives a more comprehensive picture of the return generated by a stock. We note that for Samsung Electro-Mechanics the TSR over the last 5 years was 69%, which is better than the share price return mentioned above. This is largely a result of its dividend payments!
A Different Perspective
Samsung Electro-Mechanics shareholders are up 2.1% for the year (even including dividends). But that was short of the market average. If we look back over five years, the returns are even better, coming in at 11% per year for five years. It may well be that this is a business worth popping on the watching, given the continuing positive reception, over time, from the market. While it is well worth considering the different impacts that market conditions can have on the share price, there are other factors that are even more important. To that end, you should be aware of the 1 warning sign we've spotted with Samsung Electro-Mechanics .
If you like to buy stocks alongside management, then you might just love this free list of companies. (Hint: many of them are unnoticed AND have attractive valuation).
Please note, the market returns quoted in this article reflect the market weighted average returns of stocks that currently trade on South Korean exchanges.
New: Manage All Your Stock Portfolios in One Place
We've created the ultimate portfolio companion for stock investors, and it's free.
• Connect an unlimited number of Portfolios and see your total in one currency
• Be alerted to new Warning Signs or Risks via email or mobile
• Track the Fair Value of your stocks
Have feedback on this article? Concerned about the content? Get in touch with us directly. Alternatively, email editorial-team (at) simplywallst.com.
This article by Simply Wall St is general in nature. We provide commentary based on historical data and analyst forecasts only using an unbiased methodology and our articles are not intended to be financial advice. It does not constitute a recommendation to buy or sell any stock, and does not take account of your objectives, or your financial situation. We aim to bring you long-term focused analysis driven by fundamental data. Note that our analysis may not factor in the latest price-sensitive company announcements or qualitative material. Simply Wall St has no position in any stocks mentioned.
Have feedback on this article? Concerned about the content? Get in touch with us directly. Alternatively, email editorial-team@simplywallst.com
About KOSE:A009150
Samsung Electro-Mechanics
Manufactures and sells various electronic components in Korea, China, Southeast Asia, Japan, the Americas, and Europe.
Flawless balance sheet and undervalued.

