- South Korea
- /
- Electronic Equipment and Components
- /
- KOSE:A009470
3 KRX Stocks Possibly Trading Below Intrinsic Value By Up To 43.6%

Reviewed by Simply Wall St

Consumer sentiment in South Korea softened slightly in September, reflecting cautious optimism as indicated by the Bank of Korea's Composite Consumer Sentiment Index (CCSI) score of 100.0, down from 100.8 in August. In this context, identifying undervalued stocks that may be trading below their intrinsic value can offer potential opportunities for investors looking to capitalize on market inefficiencies.
Top 10 Undervalued Stocks Based On Cash Flows In South Korea
| Name | Current Price | Fair Value (Est) | Discount (Est) |
| Samwha ElectricLtd (KOSE:A009470) | ₩52300.00 | ₩92742.80 | 43.6% |
| VIOL (KOSDAQ:A335890) | ₩9000.00 | ₩17741.30 | 49.3% |
| T'Way Air (KOSE:A091810) | ₩2960.00 | ₩5627.98 | 47.4% |
| SK Biopharmaceuticals (KOSE:A326030) | ₩103400.00 | ₩179969.09 | 42.5% |
| Lutronic (KOSDAQ:A085370) | ₩36700.00 | ₩63217.94 | 41.9% |
| Oscotec (KOSDAQ:A039200) | ₩32850.00 | ₩65156.22 | 49.6% |
| ABCO Electronics (KOSDAQ:A036010) | ₩6100.00 | ₩11521.59 | 47.1% |
| Shinsung E&GLtd (KOSE:A011930) | ₩1719.00 | ₩3014.00 | 43% |
| Global Tax Free (KOSDAQ:A204620) | ₩3675.00 | ₩6410.67 | 42.7% |
| Hd Hyundai MipoLtd (KOSE:A010620) | ₩98900.00 | ₩169508.36 | 41.7% |
Let's dive into some prime choices out of the screener.
SK hynix (KOSE:A000660)
Overview: SK hynix Inc., with a market cap of ₩126.57 trillion, manufactures, distributes, and sells semiconductor products across Korea, China, the rest of Asia, the United States, and Europe.
Operations: The company's revenue from the manufacture and sale of semiconductor products is ₩49.22 billion.
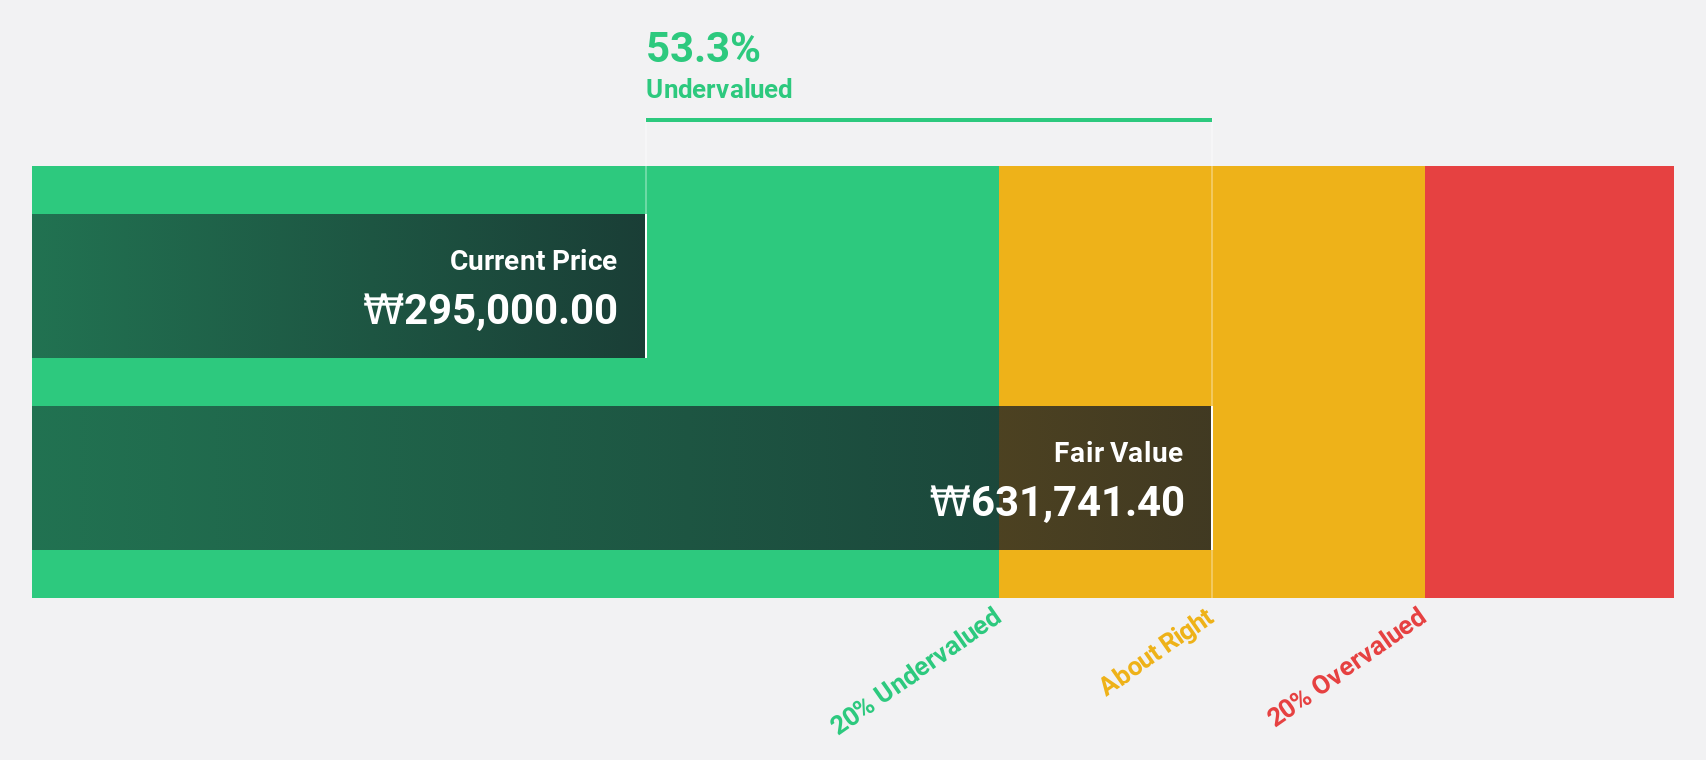
Estimated Discount To Fair Value: 11.1%
SK hynix is trading at ₩183,800, which is 11.1% below its estimated fair value of ₩206,668.11. The company's earnings are forecast to grow significantly at 49.25% annually over the next three years, outpacing the Korean market's average growth rate of 29.3%. Recent earnings reports show a substantial turnaround with net income for Q2 2024 reaching ₩4.12 trillion compared to a loss in the same period last year, indicating strong cash flow improvement and profitability recovery.
- Our growth report here indicates SK hynix may be poised for an improving outlook.
- Dive into the specifics of SK hynix here with our thorough financial health report.
Samwha ElectricLtd (KOSE:A009470)
Overview: Samwha Electric Co., Ltd. operates in the electrolytic capacitor industry both in South Korea and internationally, with a market cap of ₩345.90 billion.
Operations: The company's revenue from electronic components and parts amounts to ₩211.75 billion.
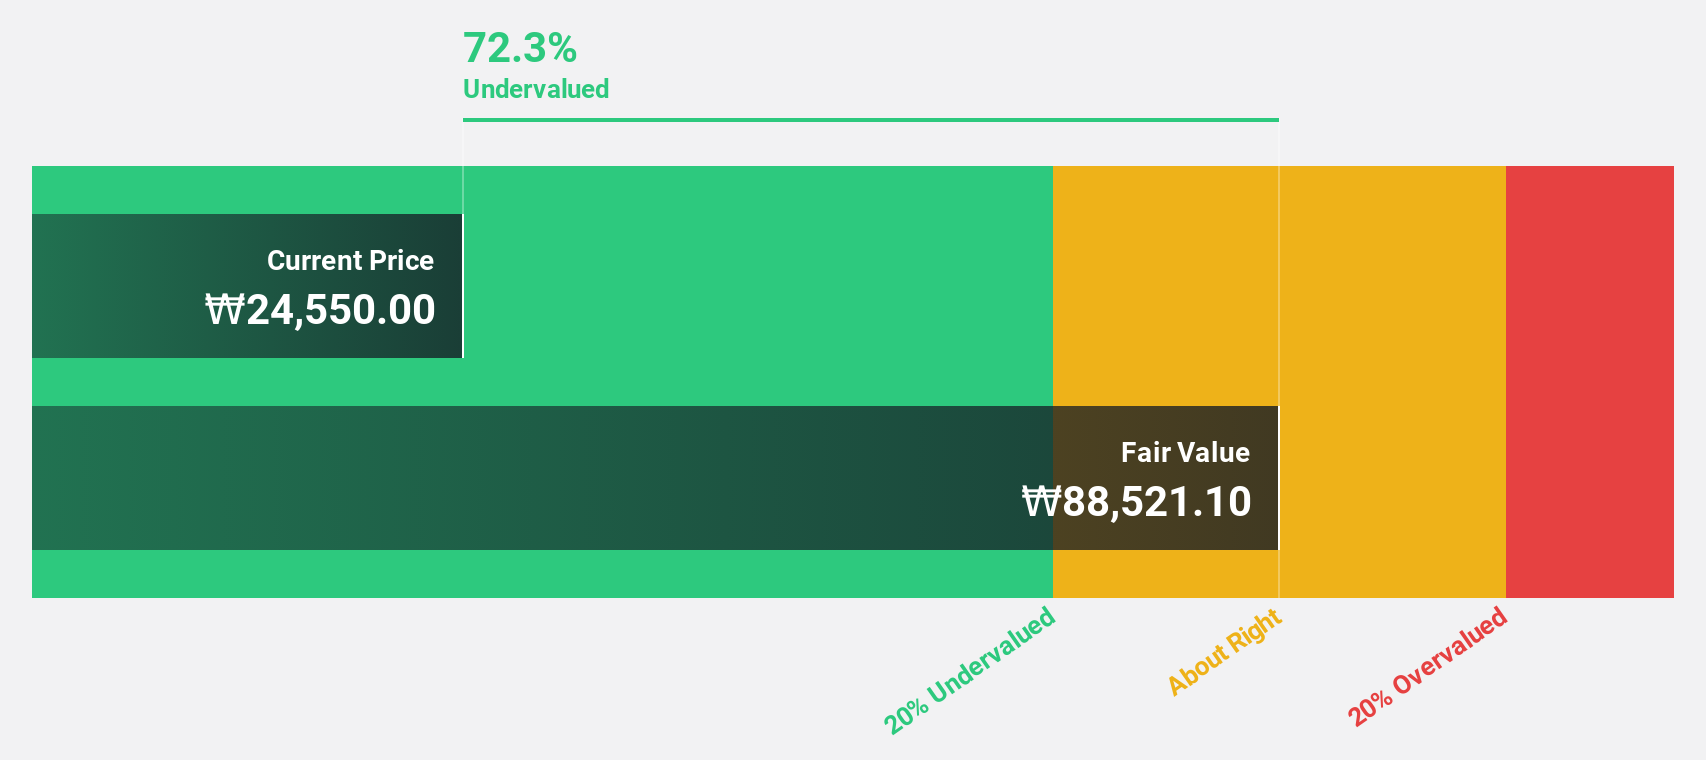
Estimated Discount To Fair Value: 43.6%
Samwha Electric Ltd. is trading at ₩52,300, significantly undervalued by 43.6% compared to its estimated fair value of ₩92,742.80. Despite highly volatile share prices over the past three months, earnings grew by 90.9% last year and are forecast to grow at an annual rate of 43.78%. Recent inclusion in the S&P Global BMI Index and strong Q2 net income of ₩6.97 billion highlight robust cash flow potential despite negative sales figures reported recently.
- The growth report we've compiled suggests that Samwha ElectricLtd's future prospects could be on the up.
- Unlock comprehensive insights into our analysis of Samwha ElectricLtd stock in this financial health report.
Hd Hyundai MipoLtd (KOSE:A010620)
Overview: Hd Hyundai Mipo Co., Ltd. manufactures, repairs, and remodels ships in South Korea and has a market cap of ₩3.94 trillion.
Operations: Hd Hyundai Mipo Ltd. generates revenue primarily from shipbuilding, amounting to ₩5.10 trillion, with adjustments of -₩870.77 million in connection adjustments.
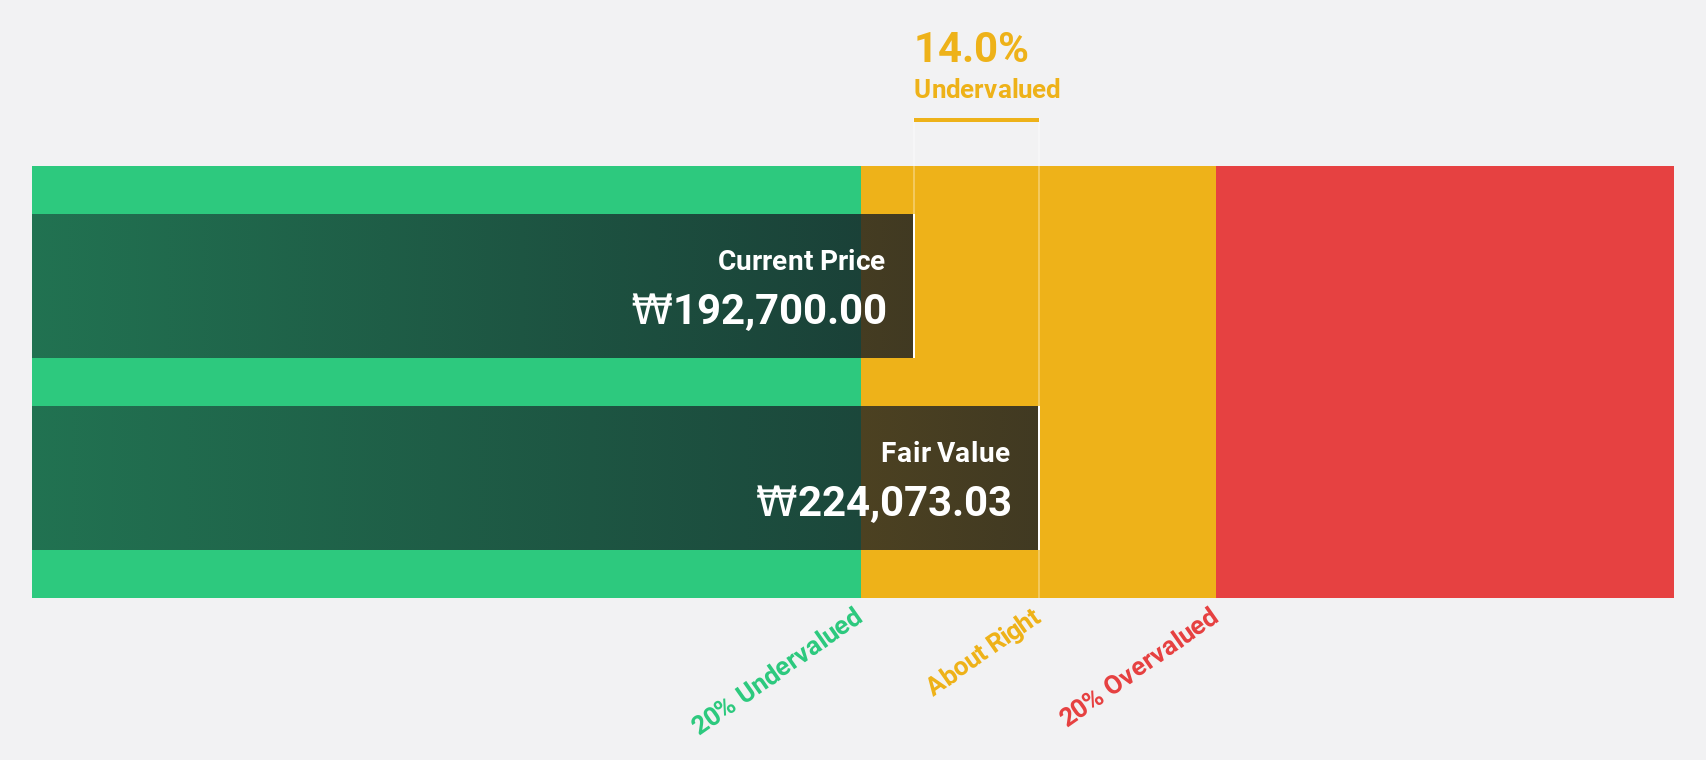
Estimated Discount To Fair Value: 41.7%
Hd Hyundai Mipo Ltd. is trading at ₩98,900, significantly below its estimated fair value of ₩169,508.36, indicating it is undervalued by over 40%. Revenue is forecast to grow at 11.4% per year, outpacing the South Korean market's average growth of 10.5%. The company is expected to become profitable within three years with earnings projected to grow by 92.49% annually. However, the return on equity forecast remains low at 16.2%.
- Our comprehensive growth report raises the possibility that Hd Hyundai MipoLtd is poised for substantial financial growth.
- Navigate through the intricacies of Hd Hyundai MipoLtd with our comprehensive financial health report here.
Where To Now?
- Navigate through the entire inventory of 32 Undervalued KRX Stocks Based On Cash Flows here.
- Are these companies part of your investment strategy? Use Simply Wall St to consolidate your holdings into a portfolio and gain insights with our comprehensive analysis tools.
- Invest smarter with the free Simply Wall St app providing detailed insights into every stock market around the globe.
Seeking Other Investments?
- Explore high-performing small cap companies that haven't yet garnered significant analyst attention.
- Diversify your portfolio with solid dividend payers offering reliable income streams to weather potential market turbulence.
- Fuel your portfolio with companies showing strong growth potential, backed by optimistic outlooks both from analysts and management.
This article by Simply Wall St is general in nature. We provide commentary based on historical data and analyst forecasts only using an unbiased methodology and our articles are not intended to be financial advice. It does not constitute a recommendation to buy or sell any stock, and does not take account of your objectives, or your financial situation. We aim to bring you long-term focused analysis driven by fundamental data. Note that our analysis may not factor in the latest price-sensitive company announcements or qualitative material. Simply Wall St has no position in any stocks mentioned.
New: Manage All Your Stock Portfolios in One Place
We've created the ultimate portfolio companion for stock investors, and it's free.
• Connect an unlimited number of Portfolios and see your total in one currency
• Be alerted to new Warning Signs or Risks via email or mobile
• Track the Fair Value of your stocks
Have feedback on this article? Concerned about the content? Get in touch with us directly. Alternatively, email editorial-team@simplywallst.com
About KOSE:A009470
Samwha ElectricLtd
Operates in the electrolytic capacitor industry in South Korea and internationally.
Flawless balance sheet with high growth potential.

