Advertisement
Global Market Insights Reveal 3 Stocks Trading Below Estimated Fair Value

Simply Wall St
Reviewed by Simply Wall St

In the current global market landscape, characterized by muted responses to new U.S. tariffs and mixed economic signals from major regions such as Europe, Japan, and China, investors are carefully navigating their strategies. Amidst these conditions, identifying stocks that are trading below their estimated fair value can offer potential opportunities for those seeking to capitalize on undervalued assets in a fluctuating environment.
Top 10 Undervalued Stocks Based On Cash Flows
| Name | Current Price | Fair Value (Est) | Discount (Est) |
| STMicroelectronics (ENXTPA:STMPA) | €26.875 | €53.29 | 49.6% |
| Resurs Holding (OM:RESURS) | SEK27.55 | SEK54.82 | 49.7% |
| Nanya New Material TechnologyLtd (SHSE:688519) | CN¥42.94 | CN¥85.19 | 49.6% |
| Medy-Tox (KOSDAQ:A086900) | ₩162200.00 | ₩322233.66 | 49.7% |
| Medhelp Care Aktiebolag (OM:MEDHLP) | SEK5.00 | SEK9.93 | 49.7% |
| Mandom (TSE:4917) | ¥1418.00 | ¥2835.64 | 50% |
| HL Holdings (KOSE:A060980) | ₩41550.00 | ₩82343.02 | 49.5% |
| Hibino (TSE:2469) | ¥2339.00 | ¥4659.50 | 49.8% |
| Aspocomp Group Oyj (HLSE:ACG1V) | €5.50 | €10.93 | 49.7% |
| Almirall (BME:ALM) | €10.64 | €21.21 | 49.8% |
Below we spotlight a couple of our favorites from our exclusive screener.
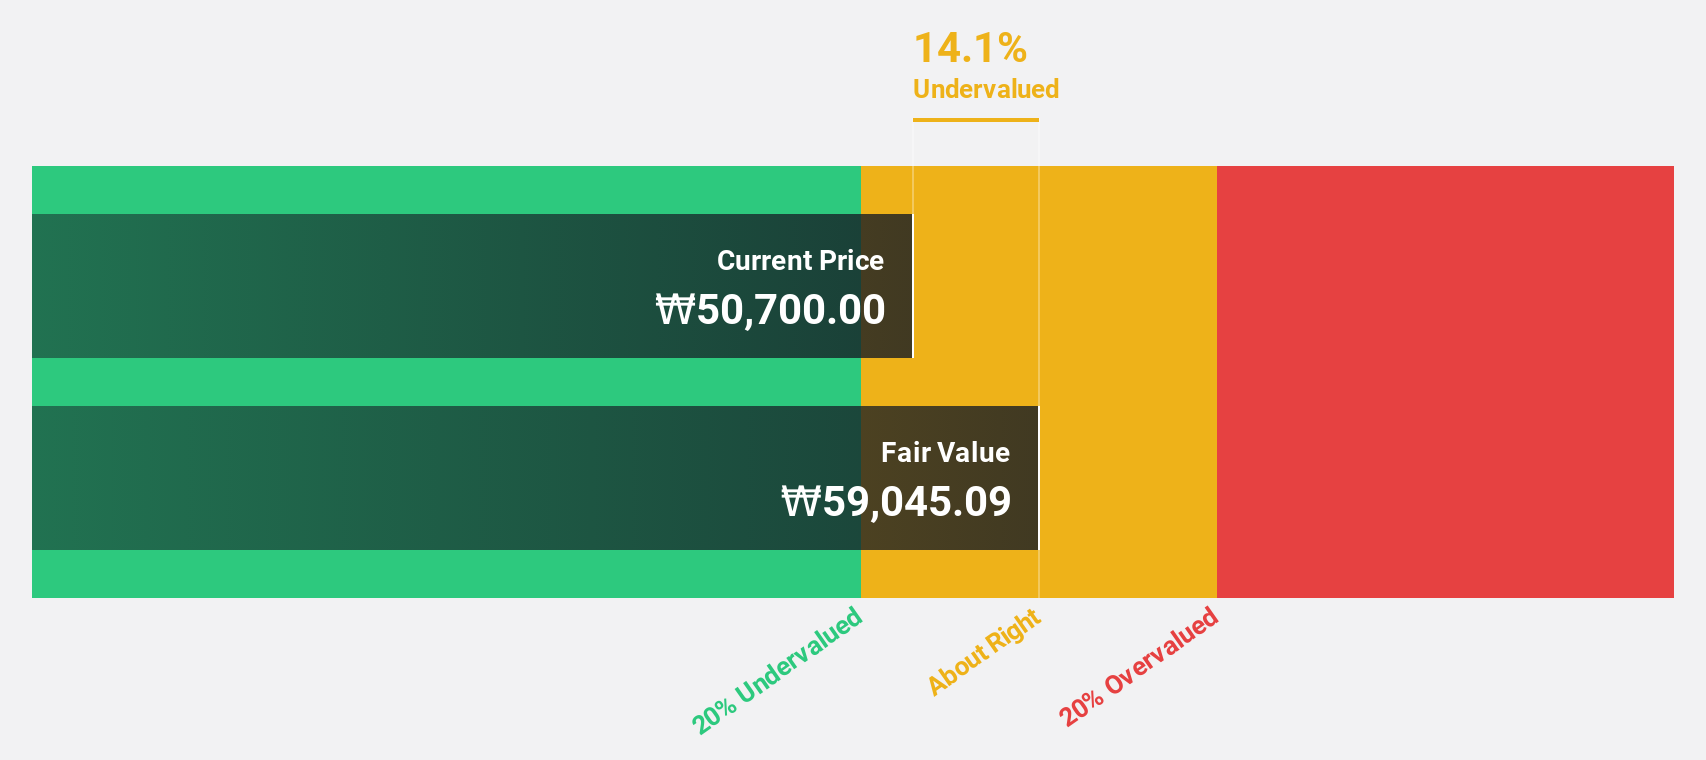
Hotel ShillaLtd (KOSE:A008770)
Overview: Hotel Shilla Co., Ltd is a hospitality company operating both in South Korea and internationally, with a market cap of ₩1.93 trillion.
Operations: The company's revenue segments include the TR Division generating ₩3.30 trillion and the Hotel & Leisure Sector, Etc. contributing ₩713.71 billion.
Estimated Discount To Fair Value: 12.6%
Hotel Shilla Ltd. is trading at ₩51,600, slightly below its estimated fair value of ₩59,020.39, indicating some undervaluation based on cash flows. Despite a high level of debt and low liquidity in shares, the company is projected to achieve an 84.02% annual earnings growth and become profitable within three years. Revenue growth is expected to outpace the Korean market at 7.4% annually but remains below 20%.
- In light of our recent growth report, it seems possible that Hotel ShillaLtd's financial performance will exceed current levels.
- Unlock comprehensive insights into our analysis of Hotel ShillaLtd stock in this financial health report.
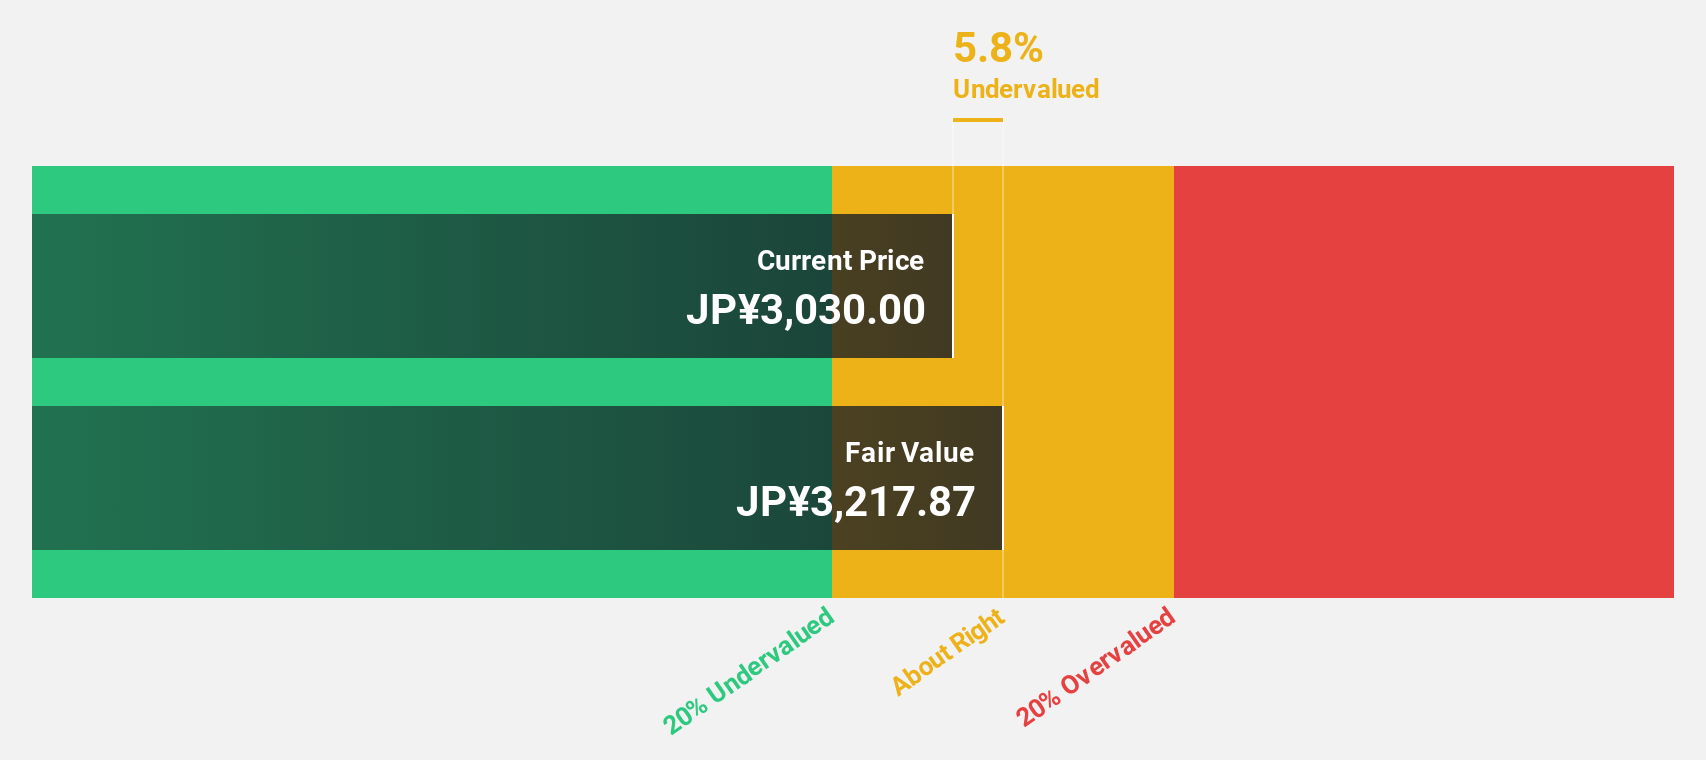
baudroieinc (TSE:4413)
Overview: Baudroie, Inc. offers optimal IT solutions in Japan and has a market cap of ¥85.69 billion.
Operations: The company generates revenue from its IT Infrastructure Business, amounting to ¥12.67 billion.
Estimated Discount To Fair Value: 11.4%
Baudroie Inc. is trading at ¥2,768, below its estimated fair value of ¥3,122.58, reflecting some undervaluation based on cash flows. Earnings are expected to grow significantly at 26.5% annually over the next three years, outpacing the Japanese market's growth rate. Revenue forecasts also show a robust increase of 25.6% per year due to strategic acquisitions and expansion efforts; however, shares remain highly illiquid and recent buybacks have slightly reduced outstanding shares.
- Our comprehensive growth report raises the possibility that baudroieinc is poised for substantial financial growth.
- Click to explore a detailed breakdown of our findings in baudroieinc's balance sheet health report.
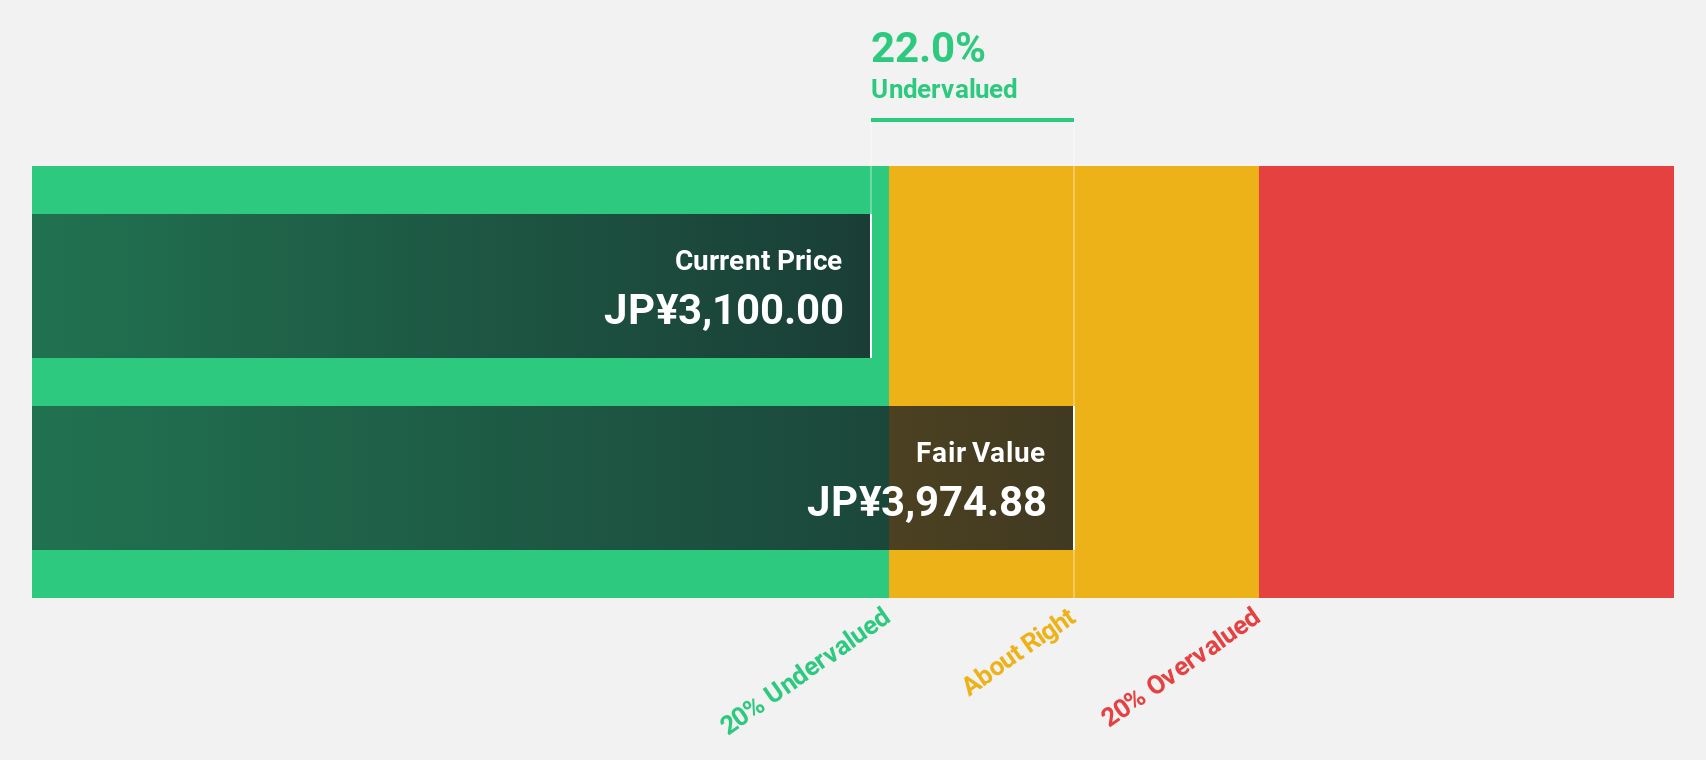
Global Security Experts (TSE:4417)
Overview: Global Security Experts Inc. is a cybersecurity education company based in Japan with a market cap of ¥42.73 billion.
Operations: Global Security Experts Inc. generates revenue from its operations in the cybersecurity education sector in Japan.
Estimated Discount To Fair Value: 31.7%
Global Security Experts is trading at ¥2,821, significantly below its estimated fair value of ¥4,127.64, highlighting undervaluation based on cash flows. The company's revenue and earnings are projected to grow substantially at 20.6% and 28% annually, respectively—both surpassing the Japanese market averages. Despite high illiquidity in shares and limited financial data availability, the anticipated robust return on equity of 42.6% in three years suggests strong potential for investors focused on cash flow valuation metrics.
- Our earnings growth report unveils the potential for significant increases in Global Security Experts' future results.
- Get an in-depth perspective on Global Security Experts' balance sheet by reading our health report here.
Seize The Opportunity
- Unlock more gems! Our Undervalued Global Stocks Based On Cash Flows screener has unearthed 469 more companies for you to explore.Click here to unveil our expertly curated list of 472 Undervalued Global Stocks Based On Cash Flows.
- Are these companies part of your investment strategy? Use Simply Wall St to consolidate your holdings into a portfolio and gain insights with our comprehensive analysis tools.
- Enhance your investing ability with the Simply Wall St app and enjoy free access to essential market intelligence spanning every continent.
Ready To Venture Into Other Investment Styles?
- Explore high-performing small cap companies that haven't yet garnered significant analyst attention.
- Diversify your portfolio with solid dividend payers offering reliable income streams to weather potential market turbulence.
- Fuel your portfolio with companies showing strong growth potential, backed by optimistic outlooks both from analysts and management.
This article by Simply Wall St is general in nature. We provide commentary based on historical data and analyst forecasts only using an unbiased methodology and our articles are not intended to be financial advice. It does not constitute a recommendation to buy or sell any stock, and does not take account of your objectives, or your financial situation. We aim to bring you long-term focused analysis driven by fundamental data. Note that our analysis may not factor in the latest price-sensitive company announcements or qualitative material. Simply Wall St has no position in any stocks mentioned.
New: Manage All Your Stock Portfolios in One Place
We've created the ultimate portfolio companion for stock investors, and it's free.
• Connect an unlimited number of Portfolios and see your total in one currency
• Be alerted to new Warning Signs or Risks via email or mobile
• Track the Fair Value of your stocks
Have feedback on this article? Concerned about the content? Get in touch with us directly. Alternatively, email editorial-team@simplywallst.com
About TSE:4413
High growth potential with excellent balance sheet.
Market Insights


Advertisement
Community Narratives
MicroStrategy: Volatile Gamble or Golden Opportunity?
Fair Value US$663.00|31.2% undervalued
BL
Community Contributor
Emerging Markets and Debt Reduction Will Propel Bath & Body Works Forward
Fair Value US$40.73|24.4% undervalued
ZW
Community Contributor
An amazing opportunity to potentially get a 100 bagger
Fair Value US$10.00|13.5% overvalued
DA
Community Contributor