
Advertisement
- South Korea
- /
- Pharma
- /
- KOSDAQ:A000250
Sam Chun Dang Pharm. Co., Ltd's (KOSDAQ:000250) 27% Share Price Surge Not Quite Adding Up
Despite an already strong run, Sam Chun Dang Pharm. Co., Ltd (KOSDAQ:000250) shares have been powering on, with a gain of 27% in the last thirty days. The last 30 days bring the annual gain to a very sharp 63%.
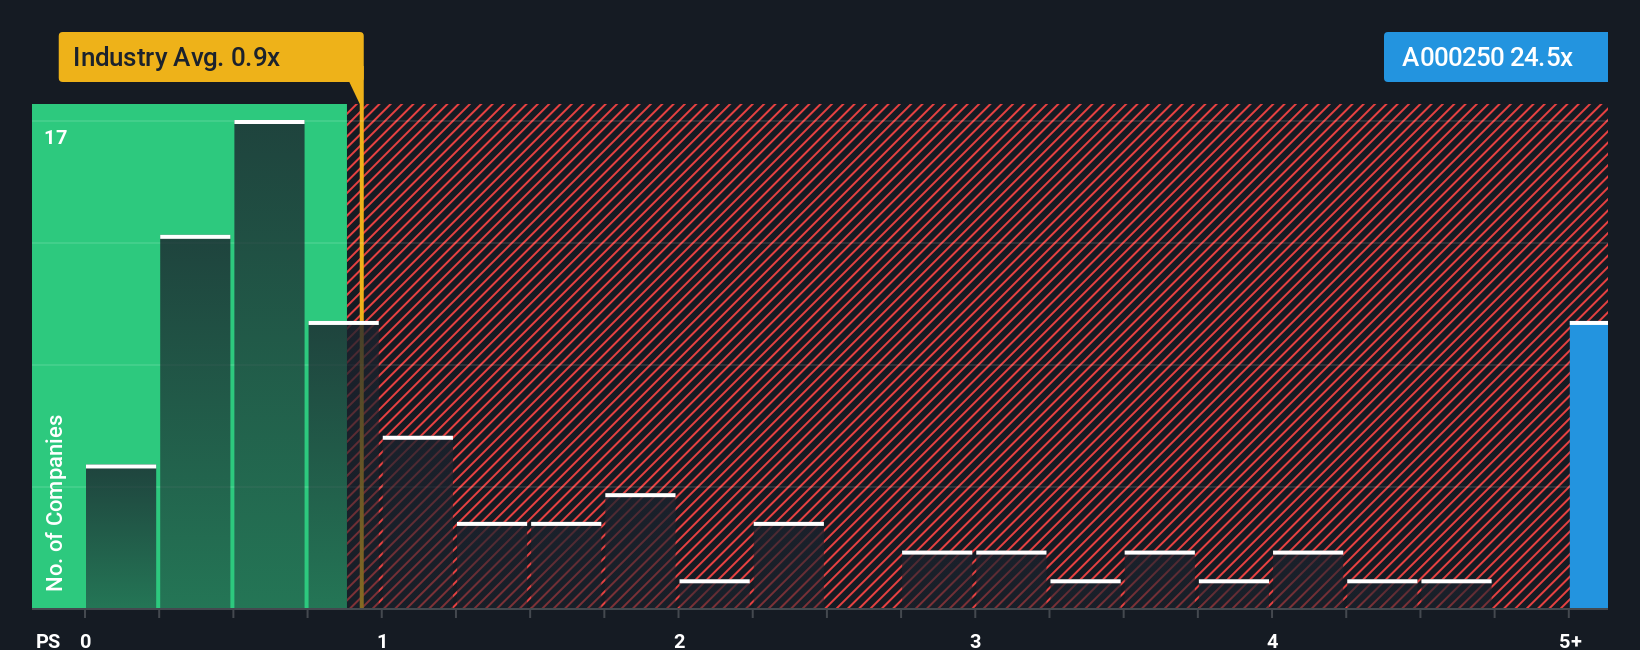
After such a large jump in price, given around half the companies in Korea's Pharmaceuticals industry have price-to-sales ratios (or "P/S") below 0.9x, you may consider Sam Chun Dang Pharm as a stock to avoid entirely with its 24.5x P/S ratio. Nonetheless, we'd need to dig a little deeper to determine if there is a rational basis for the highly elevated P/S.
See our latest analysis for Sam Chun Dang Pharm
What Does Sam Chun Dang Pharm's Recent Performance Look Like?
Revenue has risen at a steady rate over the last year for Sam Chun Dang Pharm, which is generally not a bad outcome. It might be that many expect the reasonable revenue performance to beat most other companies over the coming period, which has increased investors’ willingness to pay up for the stock. You'd really hope so, otherwise you're paying a pretty hefty price for no particular reason.
Want the full picture on earnings, revenue and cash flow for the company? Then our free report on Sam Chun Dang Pharm will help you shine a light on its historical performance.How Is Sam Chun Dang Pharm's Revenue Growth Trending?
There's an inherent assumption that a company should far outperform the industry for P/S ratios like Sam Chun Dang Pharm's to be considered reasonable.
Taking a look back first, we see that the company managed to grow revenues by a handy 5.3% last year. The solid recent performance means it was also able to grow revenue by 23% in total over the last three years. Accordingly, shareholders would have probably been satisfied with the medium-term rates of revenue growth.
This is in contrast to the rest of the industry, which is expected to grow by 18% over the next year, materially higher than the company's recent medium-term annualised growth rates.
With this in mind, we find it worrying that Sam Chun Dang Pharm's P/S exceeds that of its industry peers. Apparently many investors in the company are way more bullish than recent times would indicate and aren't willing to let go of their stock at any price. Only the boldest would assume these prices are sustainable as a continuation of recent revenue trends is likely to weigh heavily on the share price eventually.
The Bottom Line On Sam Chun Dang Pharm's P/S
Sam Chun Dang Pharm's P/S has grown nicely over the last month thanks to a handy boost in the share price. We'd say the price-to-sales ratio's power isn't primarily as a valuation instrument but rather to gauge current investor sentiment and future expectations.
Our examination of Sam Chun Dang Pharm revealed its poor three-year revenue trends aren't detracting from the P/S as much as we though, given they look worse than current industry expectations. When we see slower than industry revenue growth but an elevated P/S, there's considerable risk of the share price declining, sending the P/S lower. Unless there is a significant improvement in the company's medium-term performance, it will be difficult to prevent the P/S ratio from declining to a more reasonable level.
You always need to take note of risks, for example - Sam Chun Dang Pharm has 2 warning signs we think you should be aware of.
It's important to make sure you look for a great company, not just the first idea you come across. So if growing profitability aligns with your idea of a great company, take a peek at this free list of interesting companies with strong recent earnings growth (and a low P/E).
New: Manage All Your Stock Portfolios in One Place
We've created the ultimate portfolio companion for stock investors, and it's free.
• Connect an unlimited number of Portfolios and see your total in one currency
• Be alerted to new Warning Signs or Risks via email or mobile
• Track the Fair Value of your stocks
Have feedback on this article? Concerned about the content? Get in touch with us directly. Alternatively, email editorial-team (at) simplywallst.com.
This article by Simply Wall St is general in nature. We provide commentary based on historical data and analyst forecasts only using an unbiased methodology and our articles are not intended to be financial advice. It does not constitute a recommendation to buy or sell any stock, and does not take account of your objectives, or your financial situation. We aim to bring you long-term focused analysis driven by fundamental data. Note that our analysis may not factor in the latest price-sensitive company announcements or qualitative material. Simply Wall St has no position in any stocks mentioned.
About KOSDAQ:A000250
Sam Chun Dang Pharm
Engages in the manufacturing and sale of pharmaceutical products in South Korea.
Mediocre balance sheet with very low risk.
Market Insights

Advertisement
Community Narratives
The company that turned a verb into a global necessity and basically runs the modern internet, digital ads, smartphones, maps, and AI.
Fair Value US$300.00|10.2% undervalued
OS
Community Contributor
Flowers Foods Pays A Fair Price For Health
Fair Value US$16.12|20.3% undervalued
NV
Community Contributor
TMX Group will thrive with 33.3% profit margin and enduring market moat
Fair Value CA$49.90|0.1% undervalued
LI
Community Contributor